
Ethereum Price Analysis ETH / USD: Sting Of Rejection
After a strong technical rejection in the short-term, ETH's overall outlook is bearish.
- Ethereum has a bearish short-term bias, with the ETH / USD pair strongly rejected from the $235.00 level
- The four-hour time frame shows that a smaller bearish head and shoulders pattern may be forming
- The daily time frame shows that the ETH / USD pair’s 200-day moving average is coming back in focus
Ethereum / USD Short-term price analysis
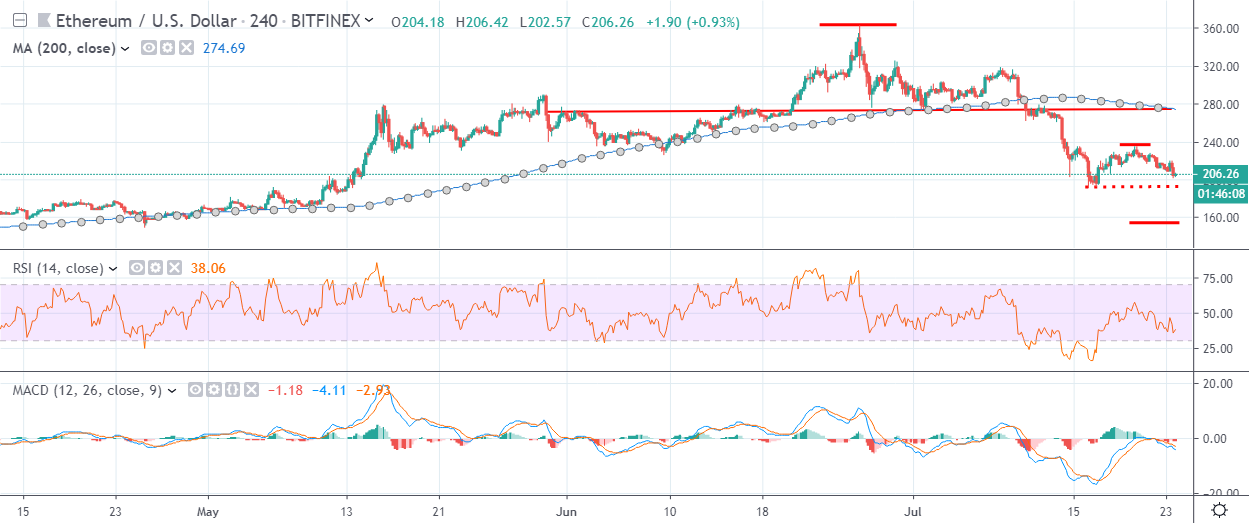
Ethereum has a bearish short-term trading bias, with the cryptocurrency sold sharply lower from key resistance on the four-hour time frame.
The four-hour time frame shows that a smaller head and shoulders pattern is starting to form, following the recent rejection from the $235.00 resistance level.
Key short-term technical support on the mentioned time frame is now located at the $193.00 and $185.00 levels.
Technical indicators across the four-hour time frame are starting to turn lower as bullish momentum fades.
Pattern Watch
Traders should note that the overall target of the smaller head and shoulders pattern on the four-hour time frame is found at the $155.00 support level.
Relative Strength Index
The RSI indicator on the four-hour time frame is turning lower and is also starting to issue a sell signal.
MACD Indicator
The MACD indicator on the four-hour time frame is bearish and is now starting to issue a sell signal.
Ethereum / USD Medium-term price analysis
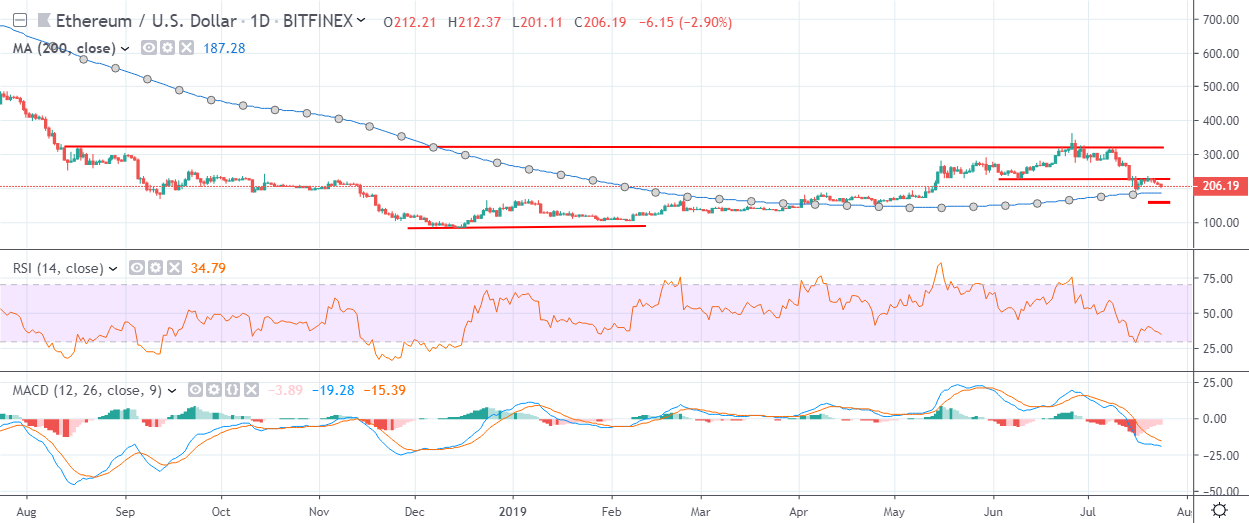
Ethereum has a neutral medium-term trading outlook, with the ETH / USD pair now approaching its trend defining 200-day moving average.
The daily time frame shows that the cryptocurrency was swiftly rejected from the June 9th swing-low, placing the emphasis back towards the ETH / USD pair’s current monthly trading low, at $192.00.
Critical technical support below the $192.00 level is located at the $186.00 and $160.00 level.
Technical indicators on the daily time frame remain bearish and continue to issue sell signals.
Pattern Watch
Traders should note that the bullish pattern on the daily time frame will remain valid while price trades above the $100.00 level.
Relative Strength Index
The RSI indicator is bearish on the daily time frame and still shows scope for further downside.
MACD Indicator
The MACD indicator on the daily time frame remains bearish and continues to issue a sell signal.
Conclusion
The ETH / USD pair is probing back towards critical technical support on both frames after suffering a strong technical rejection from the $235.00 resistance level.
Further downside towards the $160.00 to $155.00 area appears possible if the smaller head and shoulders pattern is triggered on the four-hour time frame.
Check out our introductory guide to Ethereum.