
Ethereum Price Analysis ETH / USD: Sharp Turn Approaching
Ethereum is approaching a critical juncture.
- Ethereum has a bullish short-term trading bias while trading above the $300.00 level
- The four-hour time frame shows that a bearish head and shoulders pattern still remains valid
- The daily time frame shows that buyers continue to struggle with major technical resistance
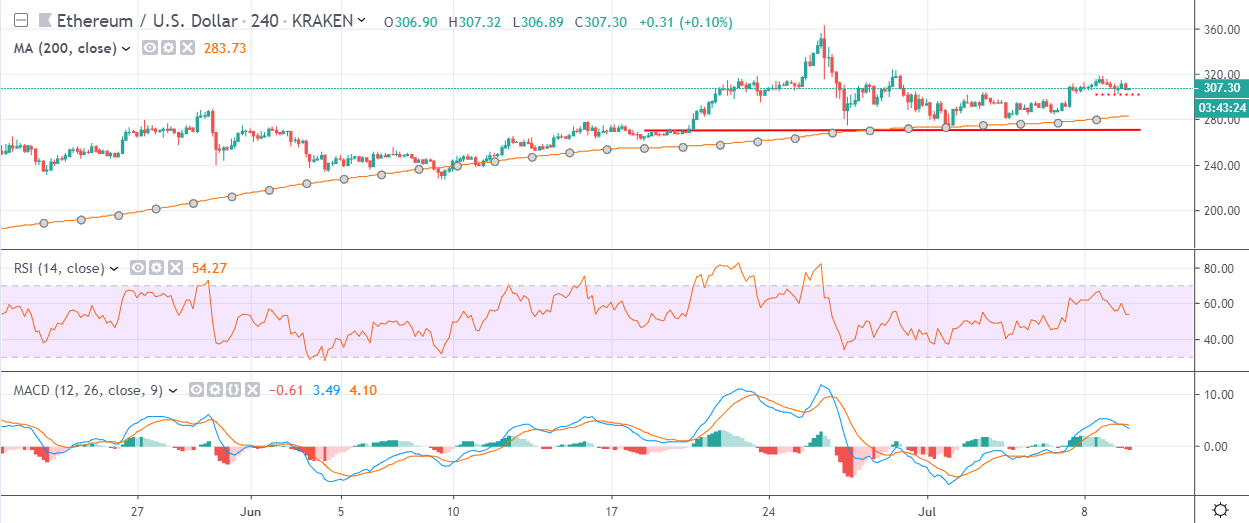
Ethereum / USD Short-term price analysis
Ethereum has a bullish short-term outlook, with the cryptocurrency continuing to hold price above the technically important $300.00 level.
The four-hour time frame shows that bulls have so far failed to invalidate a large head and shoulders pattern. Repeated technical failure around the $320.00 level may prompt sellers to try to take back control of the ETH / USD pair.
Key short-term technical support is located at the $300.00 and $278.00 levels.
Technical indicators across the four-hour time frame are starting to turn lower as short-term upside momentum fades.
Pattern Watch
Traders should note that the bearish head and shoulders pattern on the four-hour time frame holds a $90.00 downside projection.
Relative Strength Index
The RSI indicator on the four-hour time frame is turning lower and is starting to approach neutral territory.
MACD Indicator
The MACD indicator on the four-hour time frame is bearish and is starting to issue a sell signal.
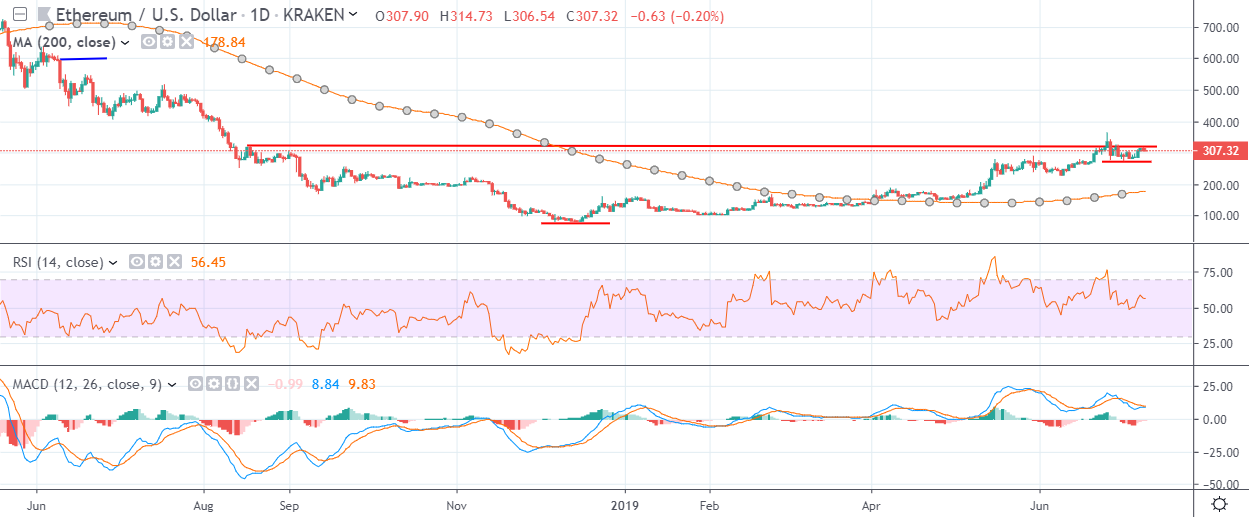
Ethereum / USD Medium-term price analysis
Ethereum has a bullish medium-term trading outlook, with the ETH / USD still pressing against breakout technical resistance on the daily time frame.
The daily time frame shows that the ETH / USD pair is struggling to overcome the neckline of a large inverted head and shoulders pattern, around the $320.00 level.
Critical technical support on the daily time frame is located around the $270.00 level.
Technical indicators on the daily time frame remain bullish, although the buy signal is currently fairly weak.
Pattern Watch
Traders should note that a much larger bullish pattern with an upside target of $600.00 has now formed on the daily time frame.
Relative Strength Index
The RSI indicator is also bullish on the daily time frame and continues to hold above the neutral level.
MACD Indicator
The MACD indicator on the daily time frame remains bullish, although downside pressures are starting to build.
Conclusion
The ETH / USD pair is trading at an important juncture technically, with a major bullish breakout or a strong technical rejection increasingly likely over the coming trading sessions.
Ethereum bulls will soon need to overcome the $320.00 resistance level or the cryptocurrency may start to come under bearish pressure below the $300.00 support level.
Check out our introductory guide to Ethereum.