 Earn with Nexo

Holochain / USD Price Analysis: Probing New Heights
The cryptocurrency is staging for new trading highs as all indicators are largely bullish.
- HOT (Holochain) has a bullish short-term outlook, with the cryptocurrency probing towards its current 2019 trading high
- Bulls are trying to invalidate a bearish head and shoulders pattern on the four-hour time frame
- The daily time frame shows that the HOT / USD pair is attempting a major technical breakout
Holochain / USD Short-term price analysis
Holo has a bullish short-term outlook, with the HOT / USD pair staging a strong technical reversal from its key 200-period moving average on the four-hour time frame.
The four-hour time frame is also showing that HOT / USD buyers are close to invalidating a bearish head and shoulders pattern that has been present since the start of April.
Technical indicators on the four-hour time frame are bullish, with the MACD indicator currently generating a strong buy signal.
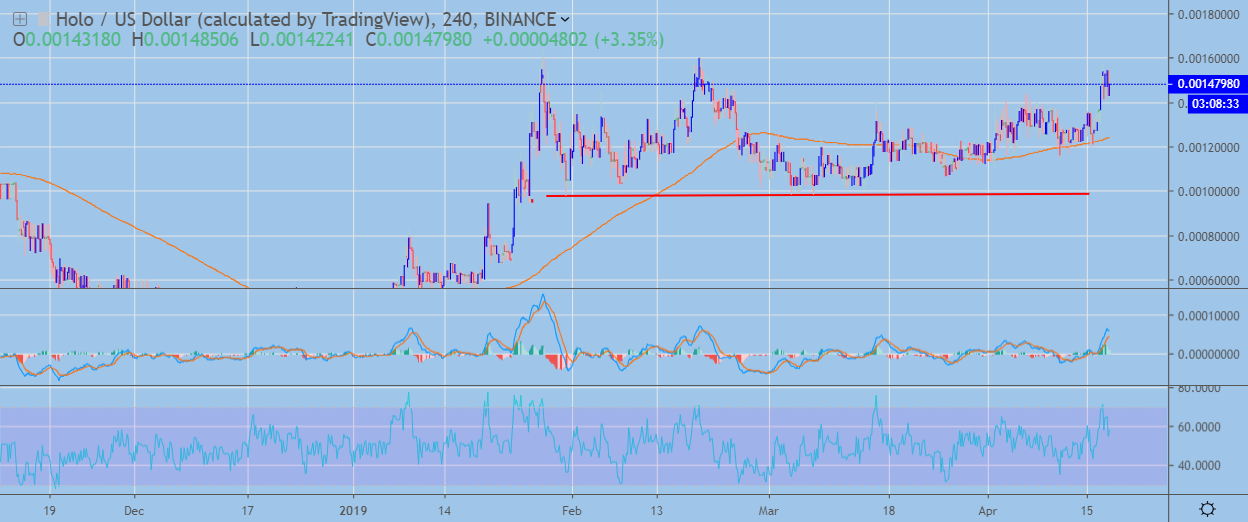 HOT / USD H4 Chart by TradingView
Pattern Watch
Traders should note that if the head and shoulders pattern is invalidated, a bullish inverted head and shoulders pattern will start to form on the four-hour time frame.
Relative Strength Index
The RSI indicator is bullish on the four-hour time frame, although it is correcting from overbought territory.
MACD Indicator
The MACD indicator is bullish on the four-hour time frame and is generating a strong buy signal.
Holochain / USD Medium-term price analysis
Holo has a bullish medium-term trading bias, with the HOT / USD pair testing towards the best levels of the year so far.
The daily time frame shows that buyers are attempting a major technical breakout above the neckline of a bullish inverted head and shoulders pattern.
Technical indicators on the daily time frame are bullish and continue to highlight growing medium-term upside pressure on the HOT / USD pair.
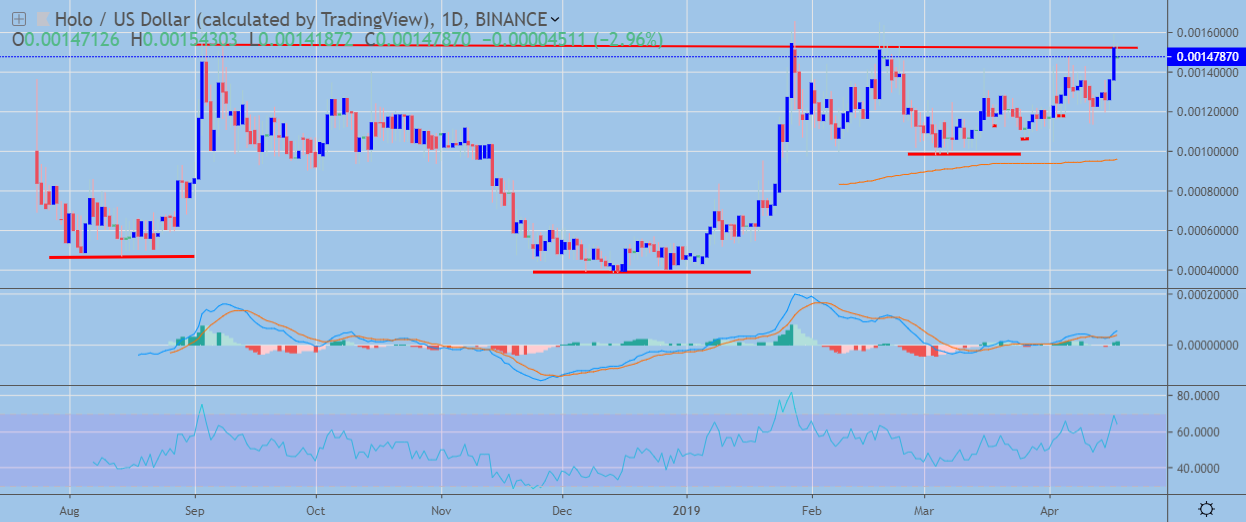 XRP / USD Daily Chart by TradingView
Pattern Watch
Traders should note that a confirmed breakout above the neckline of the inverted head and shoulders pattern would be a significant technical development for the HOT / USD pair.
Relative Strength Index
The RSI indicator is bullish on the daily time frame, although it is approaching overbought conditions.
MACD Indicator
The MACD indicator on the daily time frame is bullish and generating a strong buy signal.
Conclusion
Holo is once again on the cusp of a major bullish technical breakout, with HOT / USD buyers now needing to invalidate the bearish pattern on the four-hour time frame and ignite the large inverted head and shoulders pattern on the daily time frame.
For a quick overview of Holo and the HOT token, check out our coin guide.
A detailed analysis of the project is available in our DARE.