 Earn with Nexo
ICON Price Analysis ICX / USD: Destructive Catalyst
A breakout from trading range could occur, downwards
- ICON has a bearish short-term bias, with the cryptocurrency now trading below its 200-period moving average on the four-hour time frame
- The four-hour time frame shows that a bullish inverted head and shoulders pattern has been invalidated
- The ICX / USD pair’s medium-term outlook has turned bearish, with price trading below key technical support on the daily time frame
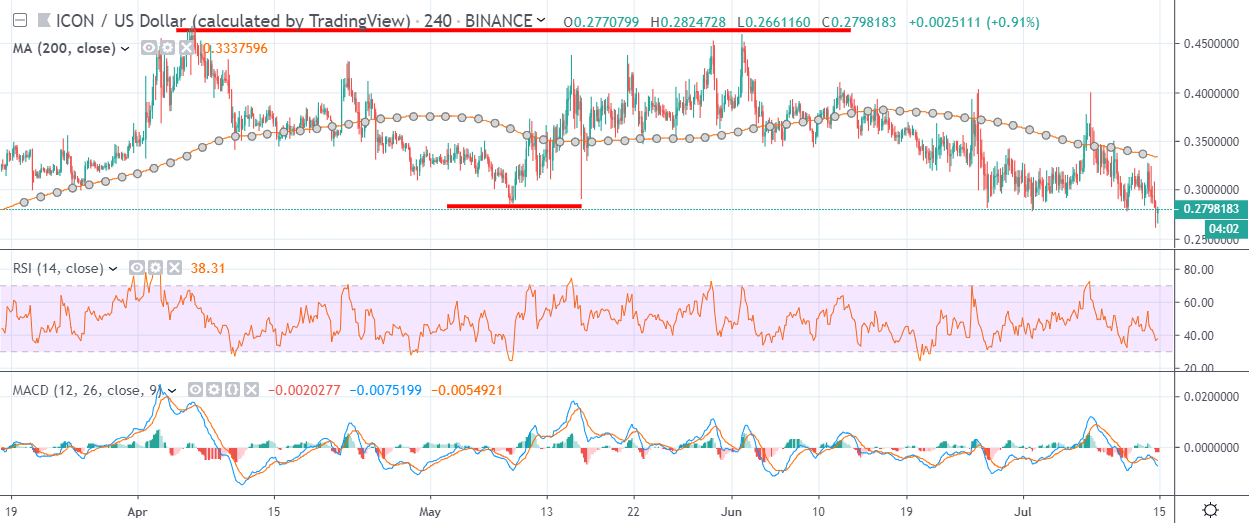
ICON / USD Short-term price analysis
ICON has a bearish short-term bias, with the ICX / USD pair now trading below its 200-period moving average on the four-hour time frame.
The four-hour time frame shows that following the recent technical reversal, bears have now invalidated a bullish inverted head and shoulders pattern.
Technical indicators on the four-hour time frame have turned bearish and continue to generate a sell signal.
Pattern Watch
Traders should note that the bearish invalidation target could see the ICX / USD pair losing a further thirty percent in value.
Relative Strength Index
The RSI indicator has also turned bearish on the four-hour time frame and still shows scope for further downside.
MACD Indicator
The MACD indicator on the four-hour time frame is bearish and continues to issue a sell signal.
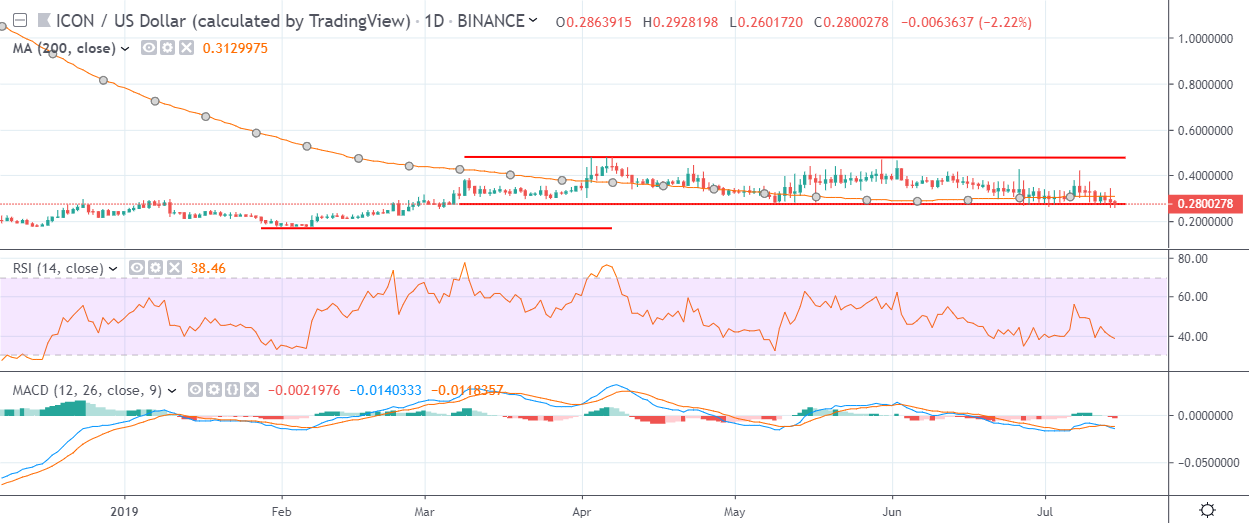
ICON / USD Medium-term price analysis
ICON has a bearish medium-term outlook, with the cryptocurrency now trading below its trend-defining 200-day moving average.
The daily time frame is showing that the ICX / USD pair is now attempting to breakout from a sideways price channel that the cryptocurrency has been trapped within since March 2019.
Technical indicators on the daily time frame are bearish and continue to generate a sell signal.
Pattern Watch
Traders should note that a sustained technical breakout from the sideways price channel could see the ICX / USD pair testing towards the February 2019 trading low.
Relative Strength Index
The RSI indicator on the daily time frame has turned bearish and is now issuing a strong sell signal.
MACD Indicator
The MACD indicator has turned bearish on the daily time frame, with the MACD histogram and signal line now issuing sell signals.
Conclusion
ICON is close to a major technical breakout on the daily time frame, with the invalidation of the bullish pattern on the four-hour time frame becoming a possible catalyst.
Overall, a confirmed technical breakout from sideways channel on the daily time frame could see the ICX / USD pair shredding close to thirty percent in value.
As always, check out our coin guide for ICON, if you are looking for a brief overview.