
IOTA / USD Price Analysis: Free Fall Averted
A recent announcement saved the pair from breaking its support, but indicators remain bearish-to-neutral.
- IOTA has a bearish short-term outlook, with the cryptocurrency still trading below its 200-period moving average
- The medium-term outlook for the IOTA / USD pair has now shifted to neutral
- The daily time frame is showing that a bullish pattern has been invalidated
IOTA / USD Short-term price analysis
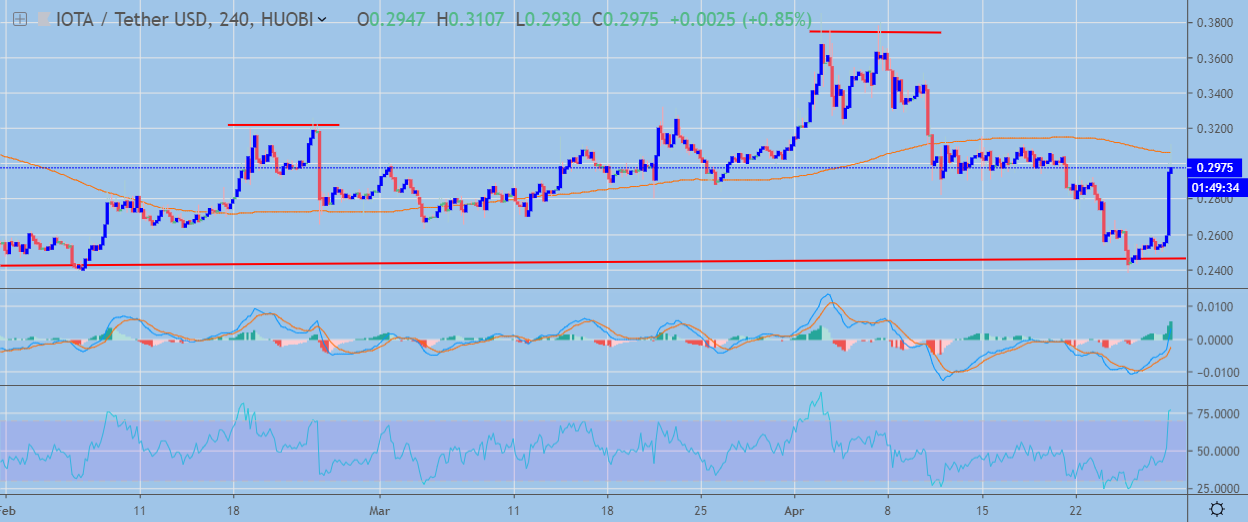
In the short-term, IOTA has a bearish trading bias with the cryptocurrency trading below its 200-period moving average on the four-hour time frame.
The four-hour time frame is showing a large head and shoulders pattern, with the IOTA / USD pair recently staging a strong recovery from the neckline of the bearish pattern.
Technical indicators are still turning higher on the four-hour time frame and continue to signal further near-term gains.
 IOTA / USD H4 Chart by TradingView
Pattern Watch
Traders should note the IOTA / USD pair could fall to a new all-time trading low if the bearish head and shoulders pattern on the four-hour time frame is triggered.
Relative Strength Index
The RSI indicator on the four-hour time frame is bullish, although it is now approaching overbought conditions.
MACD Indicator
The MACD indicator on the four-hour time frame has turned bullish and is issuing a strong buy signal.
Fundamental Analysis
IOTA surged after the announcement that Jaguar Land Rover, Britain’s largest auto manufacturer, is testing software that will allow drivers to share their vehicle data in exchange for IOTA.
IOTA / USD Medium-term price analysis
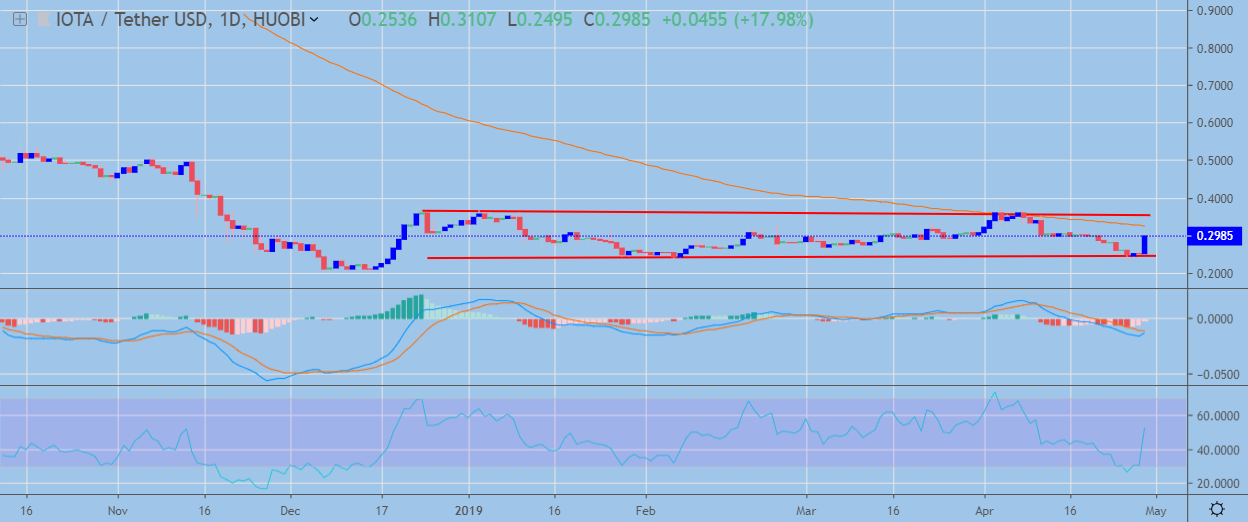
IOTA has a neutral medium-term trading outlook, with the cryptocurrency testing back towards its trend-defining 200-day moving average.
The daily time frame shows that the bullish inverted head and shoulders pattern has been invalidated by the recent decline. The daily chart is also showing that the IOTA / USD pair has now moved back into range bound trading conditions.
Technical indicators on the daily time frame are attempting to recover following the recent heavy sell-off.
 IOTA / USD Daily Chart by TradingView
Pattern Watch
Traders should note that the next direction breakout will take place once the IOTA / USD pair breaks out from the horizontal price chart on the daily time frame.
Relative Strength Index
The RSI indicator is attempting recovery above neutral following the recent bearish sell-off.
MACD Indicator
The MACD indicator on the daily time frame is neutral, although bullish pressures are building as the recovery gathers pace.
Fundamental Analysis
IOTA has been around since 2015 and is still trying to offer something viable to the market. The medium-term prospects for the project will depend on its ability to go beyond pilots and find partners that will start to use its platform.
Conclusion
The balance of risk has now shifted to the downside for the IOTA / USD in the short-term, with the buyers now needing to negate the bearish pattern on the four-hour time frame.
The medium outlook for the cryptocurrency is less certain until a confirmed technical breakout has occurred from the horizontal price channel that has been in play since the start of the year.
To get a quick refresher course on IOTA, check out our coin guide.
A deep dive analysis of IOTA is available here.