
Komodo Price Analysis KMD / USD: Insufficient Energy
Despite the beta release of the AtomicDEX, KMD remains technically bearish.
- Komodo has a bearish short-term bias, with the cryptocurrency still trading below its 200-period moving average on the four-hour time frame
- The four-hour time frame shows that a bullish inverted head and shoulders pattern has been invalidated
- The daily time frame still shows a valid inverted head and shoulders pattern
Fundamental Analysis
Komodo is starting to gain bullish momentum after the project released AtomicDEX v.0.1.6. The project has been successfully developing its decentralized exchange and currently accepts applications for the public-beta of its asset-agnostic atomic swap DEX.
Komodo / USD Short-term price analysis
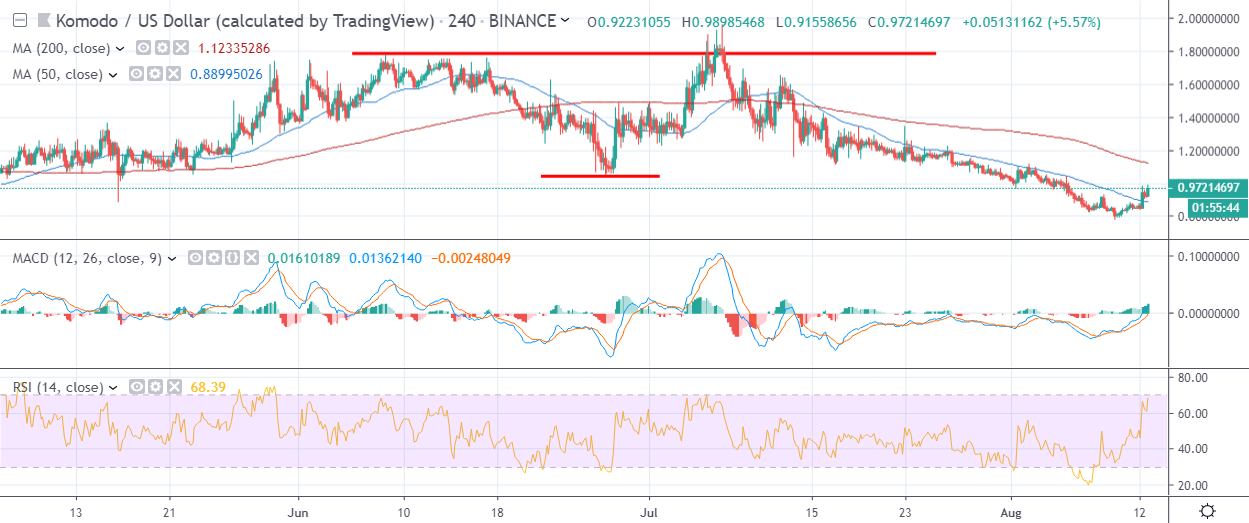
Komodo has a bearish short-term bias, with the cryptocurrency still trading below its key 200-period moving average on the four-hour time frame.
The four-hour time frame is showing that KMD / USD bears have invalidated a large inverted head and shoulders pattern. The cryptocurrency is vulnerable to further losses while trading below the invalidated pattern.
Technical indicators are bullish on the four-hour time frame and continue to generate a buy signal.
Pattern Watch
Traders should note that an even larger inverted head and shoulders pattern could start to form on the four-hour time frame if the KMD / USD pair continues to rally.
Relative Strength Index
The RSI indicator has turned bullish on the four-hour time frame and continues to issue a buy signal.
MACD Indicator
The MACD indicator is bullish on the four-hour time frame and continues to generate a strong buy signal.
Komodo / USD Medium-term price analysis
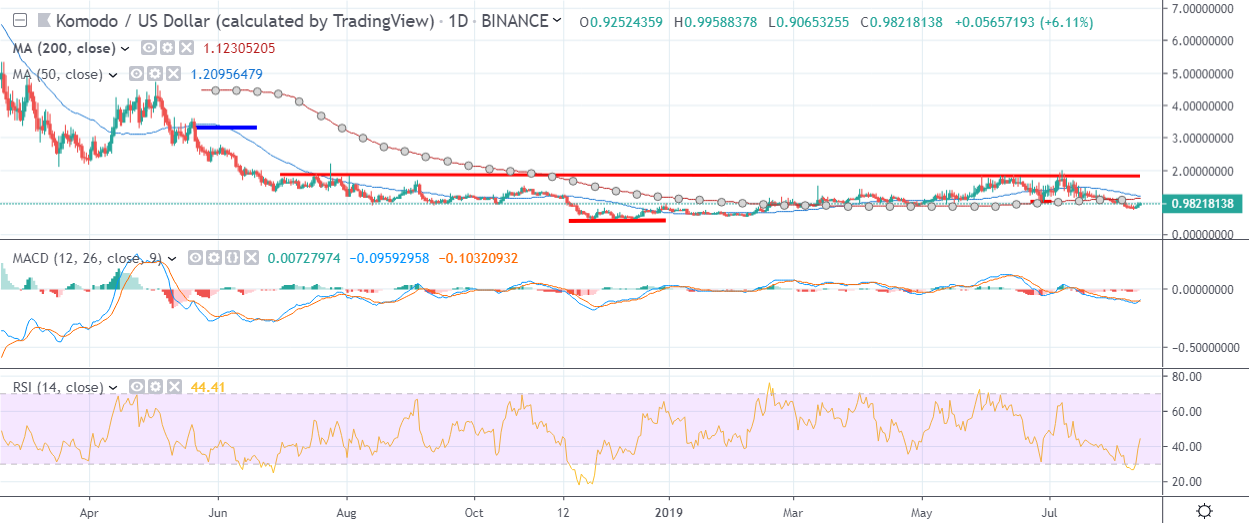
Komodo has a bearish medium-term outlook, with the cryptocurrency still trading below its trend defining 200-day moving average.
The daily time frame is showing that the KMD / USD pair is trading below key technical resistance. The recent decline has also failed to invalidate the huge inverted head and shoulders pattern on the daily time frame.
Technical indicators across the daily time frame are attempting to move higher, although they remain technically bearish.
Pattern Watch
Traders should note that the large inverted head and shoulders pattern on the daily time frame has huge upside potential.
Relative Strength Index
The RSI indicator is attempting to move higher on the daily time frame, although it is still trading below neutral.
MACD Indicator
The MACD indicator on the daily time is attempting to move higher, although it remains technically bearish.
Conclusion
Komodo is vulnerable to more short-term losses while trading below the invalidated inverted head and shoulders pattern on the four-hour time frame.
The KMD / USD pair still warrants close monitoring over the medium-term, due to the huge bullish pattern on the daily time frame remaining valid.
Check out Komodo in our coin guide.