
Litecoin Price Analysis LTC / USD: Gathering Forces
LTC is heading for a major bullish breakout.
- Litecoin has a bearish short-term bias, with the LTC / USD pair once again rejected from its 200-period moving average on the four-hour time frame
- The four-hour time frame shows that the LTC / USD pair is still trapped within a neutral triangle pattern
- The LTC / USD pair has a bullish medium-term outlook, with price holding firm above its 200-day moving average
Litecoin / USD Short-term price analysis
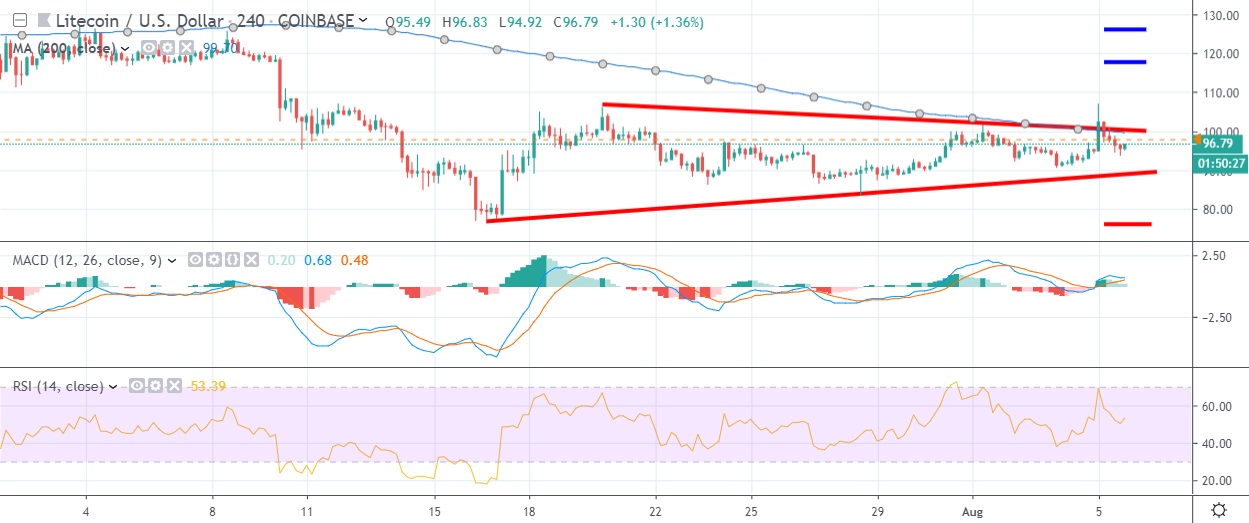
Litecoin has a bearish short-term bias, with the LTC / USD pair once again strongly rejected from its 200-period moving average on the four-hour time frame.
The four-hour time frame is showing that the LTC / USD pair remains trapped within a triangle pattern, as the fifth-largest cryptocurrency by market capitalization struggles to find direction.
Key technical resistance on the four-hour time frame is located at the $117.00, $127.00 and $140.00 levels.
Technical indicators on the four-hour time frame remain bullish, although downside pressure is starting to build.
Pattern Watch
Traders should note that the $77.00 level may come into focus if a bearish breakout from the triangle pattern occurs.
Relative Strength Index
The Relative Strength Index on the four-hour time frame remains technically bullish, although downside pressure is building.
MACD Indicator
The MACD indicator is bullish on the four-hour time frame and is currently issuing a weak buy signal.
Litecoin / USD Medium-term price analysis
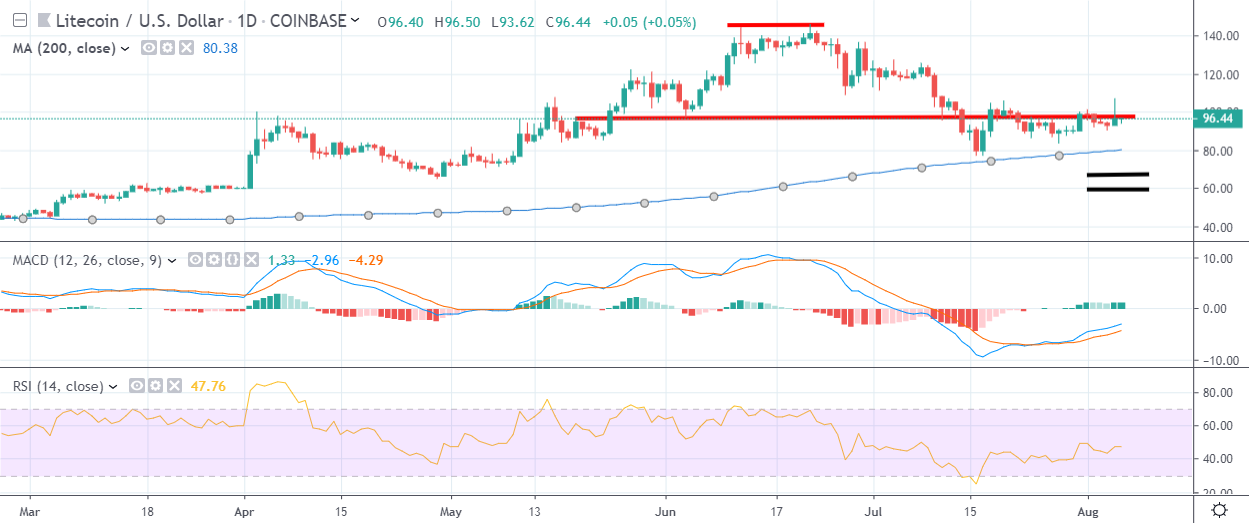
Litecoin has a bullish medium-term trading bias, with the cryptocurrency still holding price above its key 200-day moving average.
The daily time frame shows that the LTC / USD pair is once again trading below the neckline of a bearish head and shoulders pattern, following a false upside breakout.
Key technical support on the daily time frame for the LTC / USD pair remains at the $66.00 and $60.00 levels.
Technical indicators on the daily time frame currently have a slight bullish bias.
Pattern Watch
An inverted head and shoulders pattern could start to form if LTC / USD bulls negate the bearish pattern currently in play across the daily time frame.
Relative Strength Index
The Relative Strength Index is rising on the daily time frame, although it has yet to break above neutral.
MACD Indicator
The MACD indicator is bullish on the daily time frame, with both the MACD indicator and signal line rising.
Conclusion
Litecoin is on track for a major technical breakout according to the narrowing triangle pattern across the four-hour time horizons.
If bulls can force an upside breakout, the LTC / USD pair could surge towards the $140.00 level and form a large bullish pattern on the daily time frame.
Check out our coin guide for an introduction to Litecoin.
We also wrote a DARE for the project, analyzing the future prospects of the Bitcoin competitor.