
Monero Price Analysis XMR / USD: Fighting The Bear
Monero is smashing all bearish indicators.
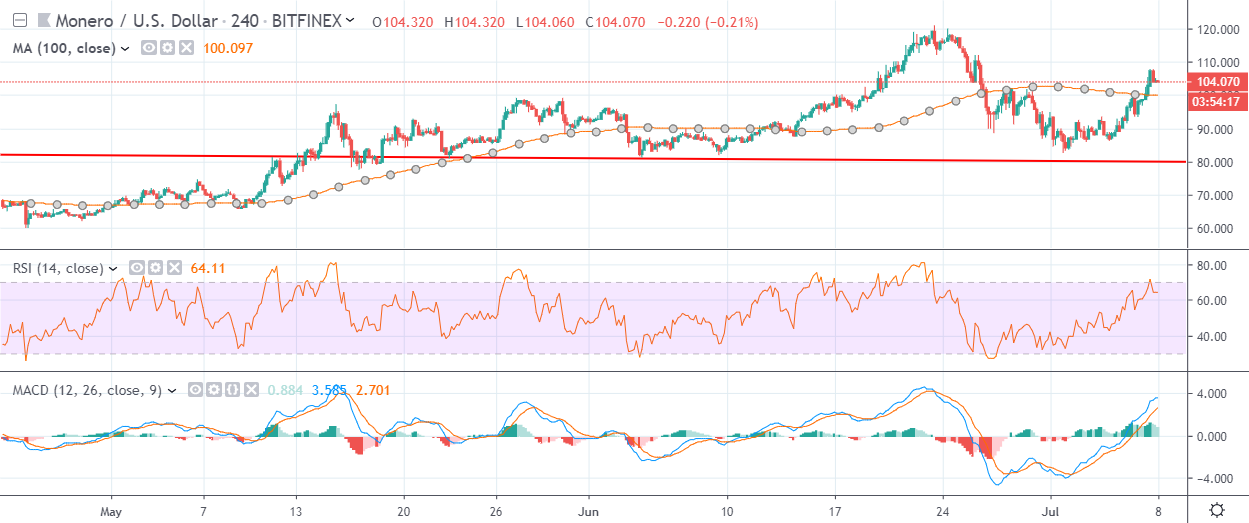
- Monero has a bullish short-term trading bias, with the XMR / USD pair recovering back above its 200-period moving average on the four-hour time frame
- The four-hour time now shows the presence of a bearish head and shoulders pattern.
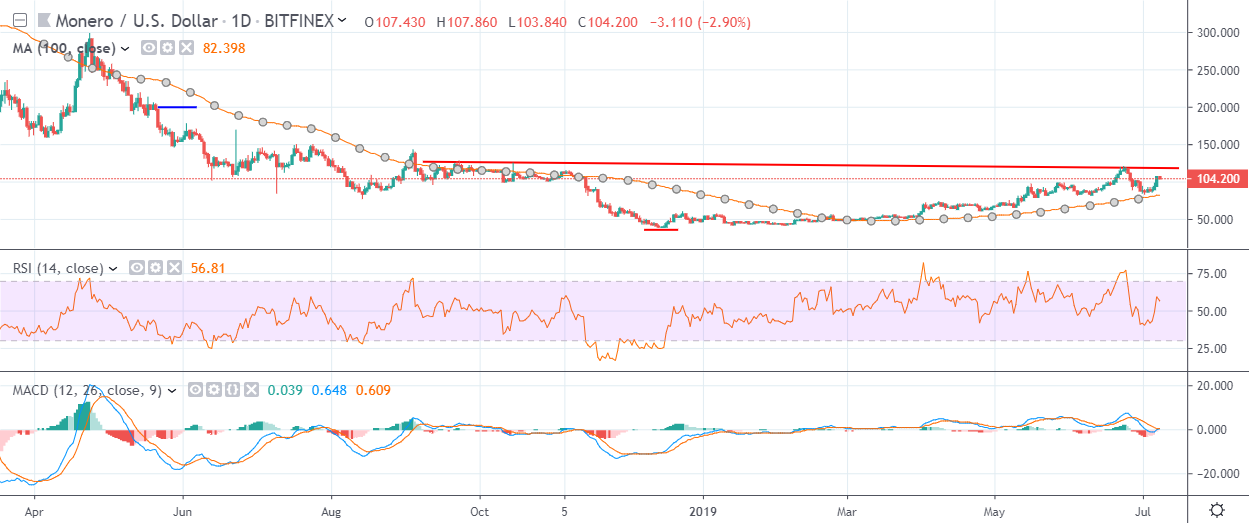
- The daily time frame shows an extremely large inverted head and shoulders pattern
Monero / USD Short-term price analysis
Monero has a bullish short-term outlook, with the cryptocurrency recovering back above its 200-period moving average on the four-hour time frame.
The four-hour time frame shows that a head and shoulders pattern has now formed, with XMR / USD bulls attempting to invalidate the bearish pattern.
Technical indicators are bullish on the four-hour time frame and continue to issue buy signals.
Pattern Watch
Traders should note that it is increasingly likely that buyers will invalidate the head and shoulders pattern due to the overall strength of the prevailing bullish trend.
Relative Strength Index
The RSI indicator is also bullish on the four-hour time frame, although it is approaching overbought territory.
MACD Indicator
The MACD indicator has turned bullish on the four-hour time frame and continues to generate a buy signal.
Monero / USD Medium-term price analysis
Monero has a bullish medium-term outlook, with the cryptocurrency holding price above its trend defining 200-day moving average.
The daily time frame is showing that a huge inverted head and shoulders pattern has now formed, with XMR / USD bulls struggling to move price above neckline resistance.
Technical indicators in the daily time frame are currently mixed and failing to generate a clear trading signal.
Pattern Watch
Traders should note that the May 21st swing-high from last year is the overall upside objective of the large bullish pattern.
Relative Strength Index
The RSI indicator has turned bullish on the daily time frame, although it is issuing a fairly weak buy signal.
MACD Indicator
The MACD Indicator on the daily time frame is neutral and is currently failing to generate a clear trading signal.
Conclusion
Monero bulls have reclaimed short-term control, making it is increasingly likely that we will see an upcoming test towards the XMR / USD pair’s current yearly trading high.
The bullish pattern on the daily time frame is certainly encouraging for medium-term bulls and suggests an eventual breakout move towards the May 21st, 2018 swing-high.
Check out the Monero coin guide for a quick look into the privacy coin.
For a deeper look we published a detailed DARE, part of our SIMETRI research offering.