
NEM Price Analysis XEM / USD: Loading The Catapult
Catapult is coming, but the technical outlook is uncertain.
- NEM has a neutral short-term-term bias, with the cryptocurrency yet to find a direction
- The four-hour time frame shows that the XEM / USD pair is trapped within a neutral wedge pattern
- The daily time frame continues to show price trading inside a sideways price channel
Fundamental Analysis
NEM is gaining momentum ahead of its Catapult upgrade. The project has recently launched a development studio to help with strategy and backend development. According to the President of Nem Foundation Alex Tinsman, “NEM Studios will be focused on creating a more user-friendly network that is built with the end-user in mind”.
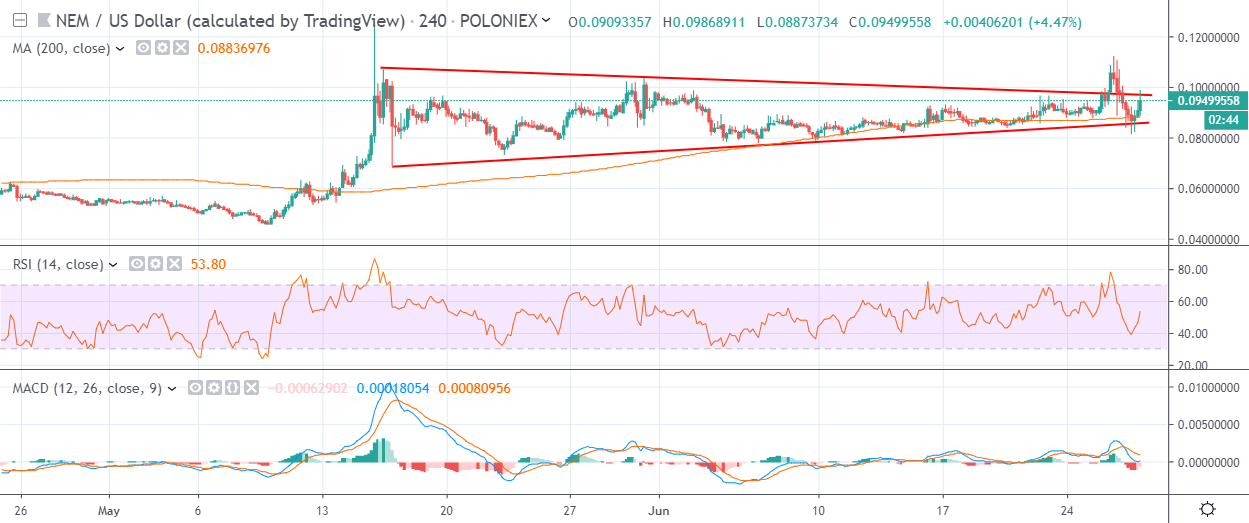
NEM / USD Short-term price analysis
NEM has a neutral short-term trading outlook, with the cryptocurrency still unable to find a clear directional bias.
The four-hour time frame is showing that the XEM / USD pair is trapped within a neutral wedge pattern, following false breakouts in both directions.
Technical indicators on the four-hour time frame are mixed and are failing to generate a clear trading signal.
Pattern Watch
Traders should wait for a clear technical confirmation of a breakout from the wedge pattern on the four-hour time frame.
Relative Strength Index
The RSI indicator is attempting to recover higher on the four-hour time frame, although it is technically bearish.
MACD Indicator
The MACD indicator on the four-hour time frame is conflicted, with the MACD signal line and histogram generating opposing trading signals.
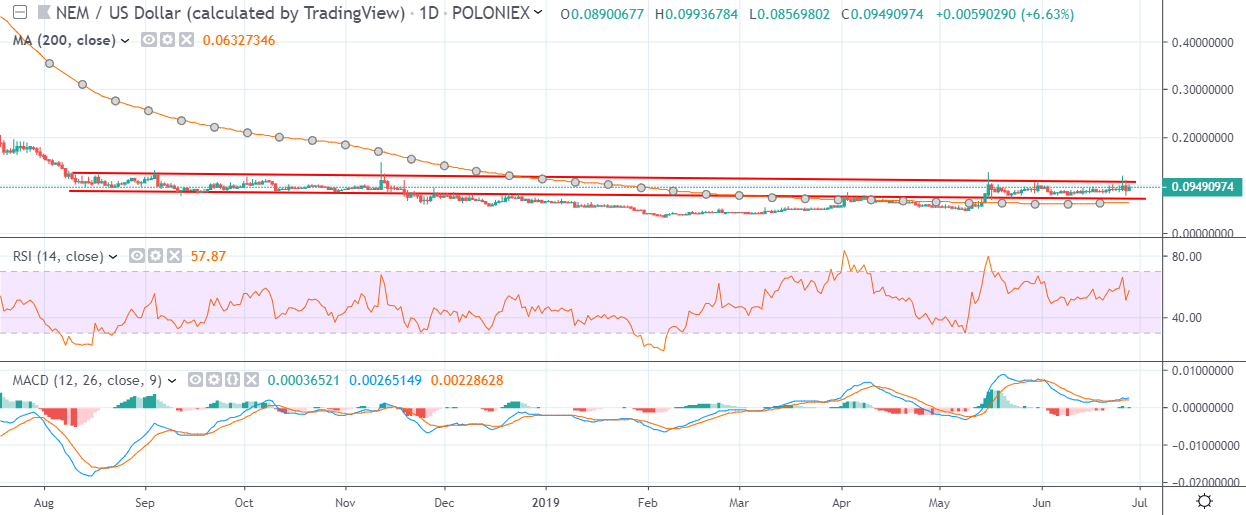
NEM / USD Medium-term price analysis
NEM has a bullish medium-term trading outlook, with the cryptocurrency still trading well above its trend defining 200-day moving average.
The daily time frame shows that the XEM / USD is still trapped within a large sideways price channel, with bulls struggling to move the cryptocurrency into a higher price range.
Technical indicators on the daily time frame are mixed and are currently failing to provide a clear trading signal.
Pattern Watch
Traders should note that a large inverted head and shoulders pattern can also be seen on the daily time frame.
Relative Strength Index
The RSI indicator on the daily time frame has a slight bullish bias, although the trading signal is fairly weak.
MACD Indicator
The MACD Indicator is currently neutral on the daily time frame and failing to generate a clear trading signal.
Conclusion
Short and medium-term indecision is currently weighing on NEM, with traders increasingly unsure which way the cryptocurrency is likely to break.
A fundamental catalyst may be needed before the XEM / USD pair picks a clear directional bias and breaks free from its current neutral trading stance.
Check out our coin guide for NEM to get a quick glance of the essentials.
For a deeper dive, our DARE for NEM is available.