
NEO Price Analysis NEO / USD: Parabolic Ascent
A great technical outlook is fueled by development upgrades.
- NEO has a bullish short-term outlook, with the cryptocurrency moving to a fresh 2019 trading high
- The four-hour time frame is showing that a large inverted head and shoulders pattern has formed
- The daily time frame is showing that bulls have successfully invalidated a large bearish pattern
NEO / USD Short-term price analysis
NEO has a bullish short-term trading outlook, with the cryptocurrency advancing to a fresh 2019 trading high.
The four-hour time frame is showing that a bullish inverted head and shoulders pattern has been created, with the NEO/ USD pair now testing above neckline support.
Technical indicators on the four-hour time frame are bullish and continue to issue a strong buy signal.
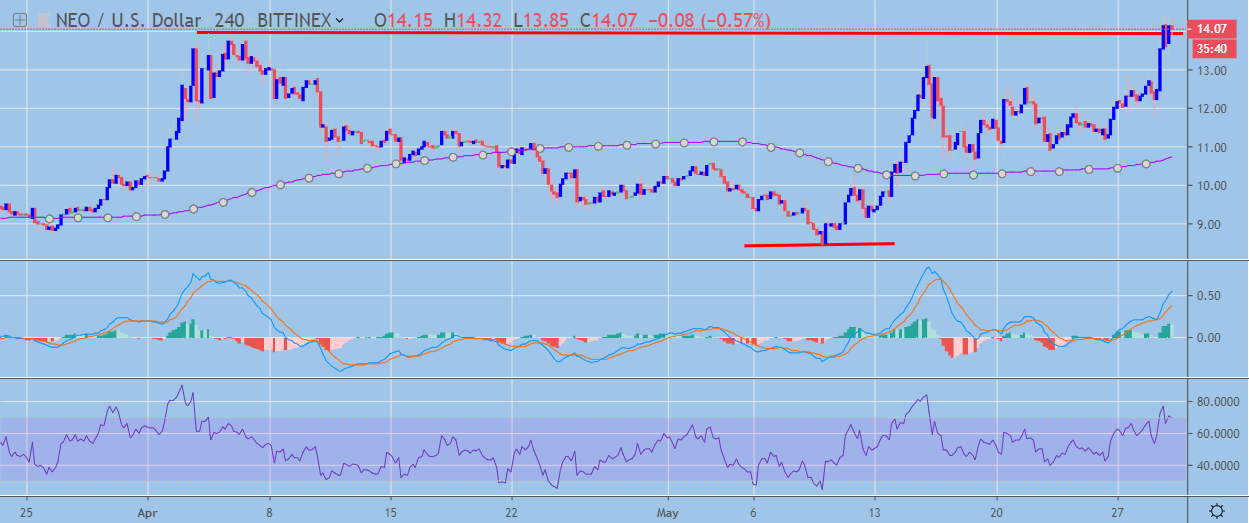 NEO / USD H4 Chart by TradingView
Pattern Watch
Traders should note the upside target of the inverted head and shoulders pattern would take the NEO/ USD pair above the 20.00 level.
Relative Strength Index
The RSI indicator on the four-hour time frame is bullish, although it is approaching overbought territory.
MACD Indicator
The MACD indicator is bullish on the four-hour time frame and is continuing to generate a buy signal.
Fundamental Analysis
NEO has gained bullish momentum after the announcement of a mainnet upgrade, scheduled for June 3. The update is expected to improve network stability and will not affect ordinary users.
NEO / USD Medium-term price analysis
NEO has a bullish medium-term outlook, with the cryptocurrency continuing to breakout after moving above its trend defining 200-period moving average.
The daily time frame is showing that bulls have now invalidated a head and shoulders pattern and are attempting to keep price above the head of the bearish pattern.
Technical indicators on the daily time frame are still bullish and continue to generate buy signals.
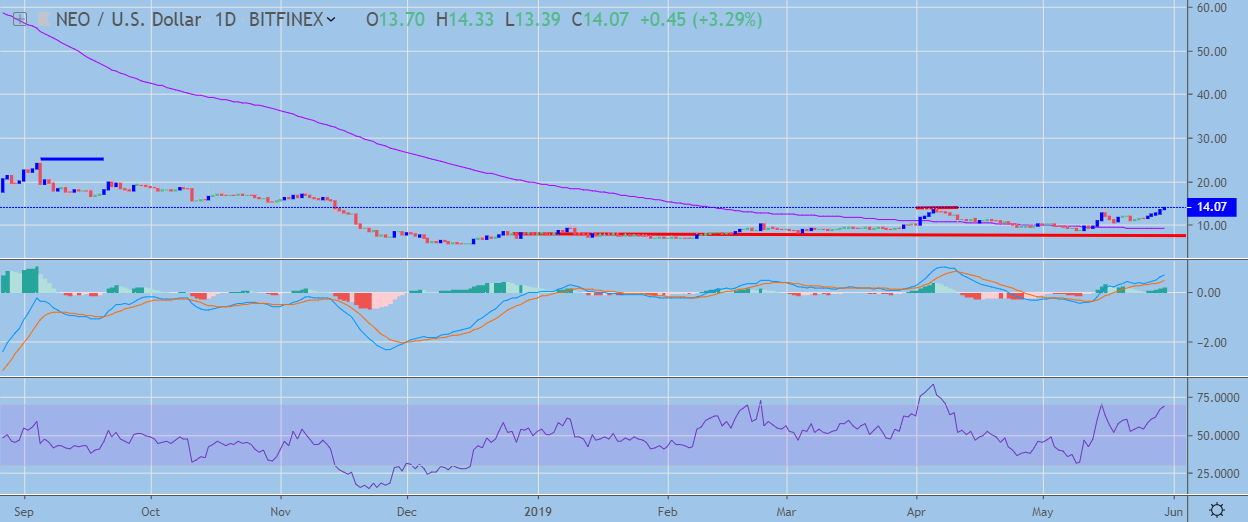 NEO / USD Daily Chart by TradingView
Pattern Watch
Traders should note that the upside target of the invalidated head and shoulders pattern is the September 2018 trading high.
Relative Strength Index
The RSI indicator is bullish on the daily time frame and still shows scope to trade higher.
MACD Indicator
The MACD indicator on the daily time frame is bullish and continues to issue a strong buy signal.
Fundamental Analysis
The project’s medium-term prospects will depend on its ability to drive adoption of the platform. Although NEO is taking steps to improve its technology, it still lags behind its major rivals in the market.
Conclusion
Neo has an increasingly bullish trading outlook across both time frames and appears to be on the cusp of another major bullish breakout.
If bulls can ignite the large bullish pattern on the four-hour time frame, the cryptocurrency could soar towards levels not seen since May of last year.
For a quick look into NEO, check out our coin guide.