

Shutterstock cover by Voar CC
Polygon’s MATIC Could Face a Correction
Polygon looks shaky as technical indicators are pointing to a brief correction in the near term.
Polygon looks primed for a retracement after soaring in market value over the past month. Still, there is a massive area of support that may help its price hold.
Polygon Forms Local Top
Polygon appears to be preparing for a correction, but it has yet to break through a vital support cluster.
MATIC has enjoyed a rally over the past month. It surged by more than 200%, rising from a low of $0.32 to hitting a high of $0.98 on July 18. Given the significance of the upswing, it appears that the token is now trading in overbought territory.
The Tom DeMark (TD) Sequential indicator has presented a sell signal on MATIC’s daily chart. The bearish formation developed as a green nine candlestick, which is indicative of a one to four candlesticks correction. The pessimistic outlook was strengthened when the current red two candlesticks began to trade below the previous red one candlestick.
The news moving money, markets, and the world—before your day starts.
Daily. Free. Join 34,000+ readers across crypto, finance, and policy.
However, MATIC is holding above a significant support cluster represented by the Parabolic SAR, the 100-day moving average and the 78.6% Fibonacci retracement indicator at $0.77. A daily candlestick close below this critical interest zone could result in a spike in downward pressure, potentially leading to a 22% correction toward the 50-day moving average at $0.58.
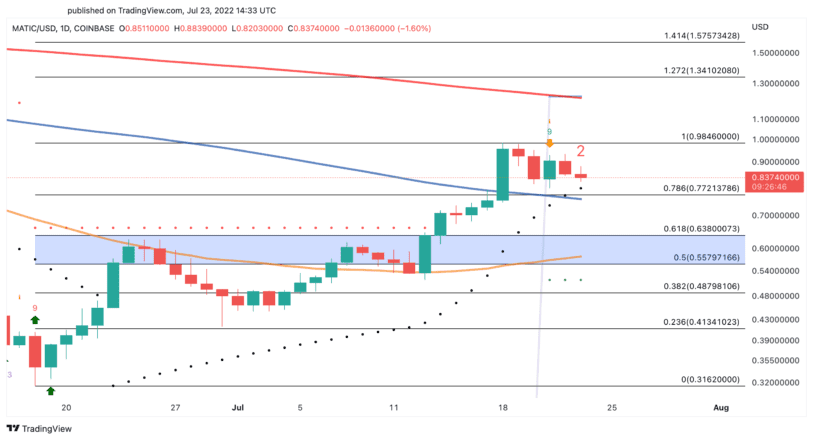
MATIC will likely need to break the July 18 high of $0.98 to invalidate the pessimistic outlook. Slicing through this vital resistance level could give it the strength to advance toward the 200-day moving average at $1.20.
Disclosure: At the time of writing, the author of this feature owned BTC and ETH.