 Earn with Nexo

QuarkChain Price Analysis QKC / USD: Technical Meltdown
The market is flush with new QKC tokens.
- QuarkChain has a bearish short-term bias, with the cryptocurrency coming under increasing selling pressure
- The QKC / USD pair is approaching major technical support on the four-hour time fame
- Technical indicators across both time frames are offering strong sell signals
Fundamental Analysis
QuarkChain continues to move downwards. In the recent community vote a decision was made to unlock all the delayed tokens at once. This increases the circulating supply of QKC and may provoke a sell-off. There have also been several large QKC transactions to Binance, indicating that large players may be getting ready to sell.
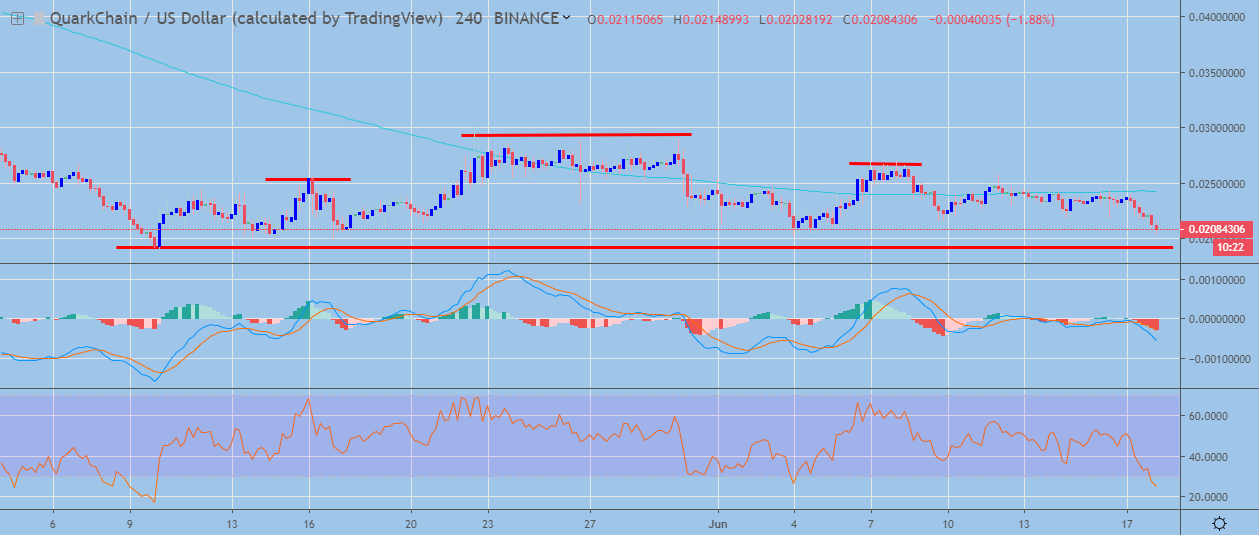
QuarkChain / USD Short-term price analysis
QuarkChain has a bearish short-term outlook, with the cryptocurrency undergoing a strong downward reversal on the four-hour time frame.
The four-hour time frame shows that a bearish head and shoulders pattern has now formed, with the QKC / USD pair falling towards neckline support.
Technical indicators on the four-hour time frame have turned bearish and are offering a strong sell signal.
Pattern Watch
Traders should note that the downside projection of the bearish pattern on four-hour time frame will take the QKC / USD pair to a new all-time price low.
Relative Strength Index
The RSI indicator is still bearish on the four-hour time frame and continues to turn lower as selling pressure builds.
MACD Indicator
The MACD indicator is bearish on the four-hour time frame and continues to generate a strong sell signal.
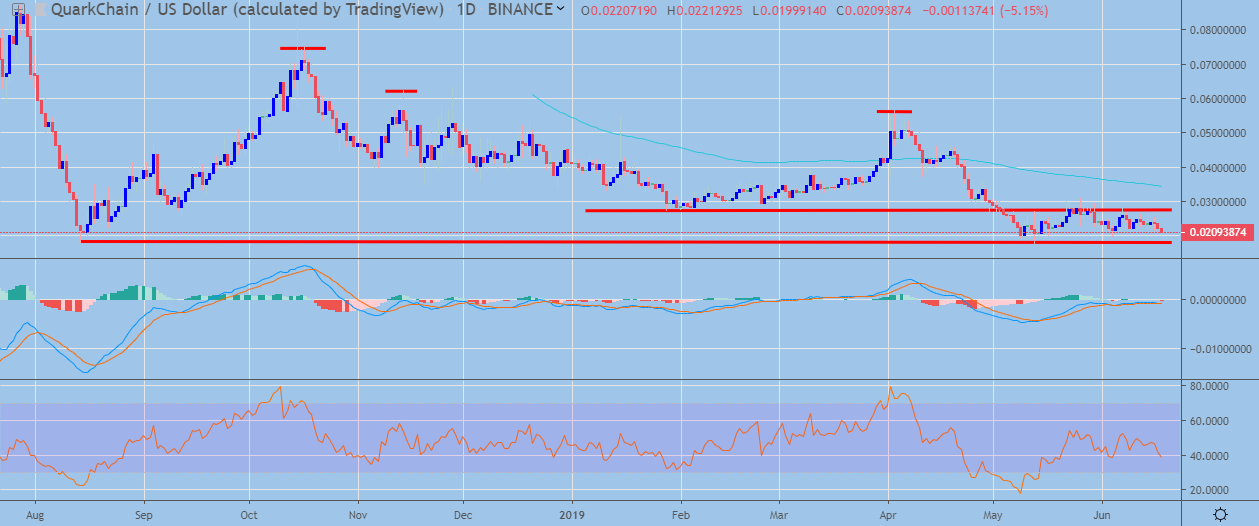
QuarkChain / USD Medium-term price analysis
QuarkChain has a bearish medium-term outlook, with the QKC / USD pair continuing to post bearish lower highs on the daily time frame.
The daily time frame is showing that a series of bearish head and shoulders patterns have now formed, with the QKC / USD pair trading towards critical neckline support.
Technical indicators on the daily frame are bearish and continue to generate a sell signal.
Pattern Watch
Traders should note that a major bearish breakdown could occur in the QKC / USD pair if the cryptocurrency breaches its all-time price low.
Relative Strength Index
The RSI indicator has turned bearish on the daily time frame and shows scope for further downside.
MACD Indicator
The MACD indicator is now starting to issue a sell signal on the daily time frame.
Conclusion
QuarkChain is under significant downside pressure across both time horizons, with the cryptocurrency approaching critical support on the four-hour and daily time frames.
If bears successfully breach the QKC / USD pair’s all-time trading low a technical meltdown could ensue.
Find out what QuarkChain is all about in our coin guide.