
Ravencoin Price Analysis RVN / USD: Bullish Falling Wedge
A falling wedge pattern keeps the medium-term positive for Ravencoin.
- Ravencoin has a bearish short-term bias, with the RVN / USD pair falling below its 200-period moving average on the four-hour time frame
- The RVN / USD pair is still bullish over the medium-term and continues to trade above its 200-day moving average
- A bullish falling wedge pattern can be seen on the daily time frame
Ravencoin / USD Short-term price analysis
Ravencoin has a bearish short-term trading bias, with the cryptocurrency falling below its 200-period moving average on the four-hour time frame.
The four-hour time frame shows that a complex head and shoulders pattern has formed, with the RVN / USD pair probing the neckline of the bearish pattern.
Technical indicators on the four-hour have turned bearish and continue to move lower.
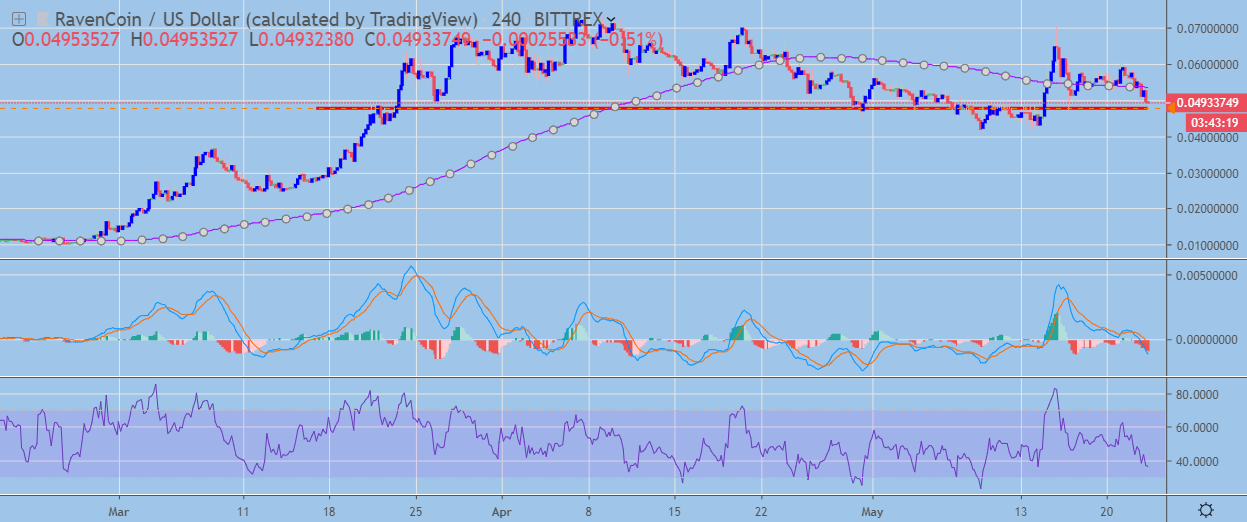 RVN / USD H4 Chart by TradingView
Pattern Watch
Traders should note that bulls have recently failed to invalidate the bearish head and shoulders pattern on the four-hour time frame.
Relative Strength Index
The RSI indicator is still bearish on the four-hour time frame and shows scope for further downside.
MACD Indicator
The MACD indicator has turned bearish on the four-hour time frame and continues to generate a sell signal.
Ravencoin / USD Medium-term price analysis
Ravencoin has a bullish medium-term outlook, with the RVN / USD pair still trading well above its 200-day moving average.
The daily time frame is showing that a falling wedge pattern has formed, with the RVN / USD pair testing lower after a false technical breakout above the bullish pattern.
Technical indicators on the daily frame are falling and are close to turning bearish.
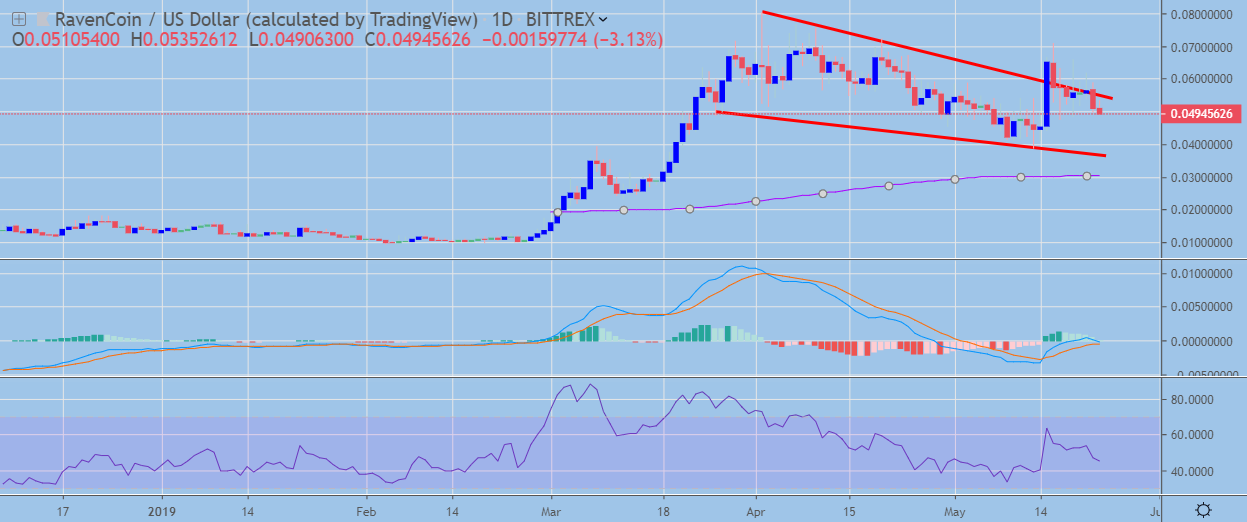 RVN / USD Daily Chart by TradingView
Pattern Watch
Traders should note that falling wedge patterns are typically bullish and have a higher percentage of success during uptrends.
Relative Strength Index
The RSI indicator has turned bearish on the daily time frame and shows scope for further downside.
MACD Indicator
The MACD indicator is attempting to turn bearish on the daily time frame.
Conclusion
Ravencoin is likely to come under further downside pressure in the short-term if sellers can trigger the bearish pattern on the four-hour time frame.
The medium-term prospects for the RVN / USD pair still remain solid, with the falling wedge pattern on the daily time frame suggesting that cryptocurrency can still trade much higher.
The name isn’t very descriptive, but Ravencoin is an interesting project we covered in our coin guide.