
Ravencoin Price Analysis RVN / USD: Flight Fatigue
After reaching its highest trading level, RVN has come under selling pressure.
- Ravencoin is currently bullish over the short-term and bearish over the medium-term
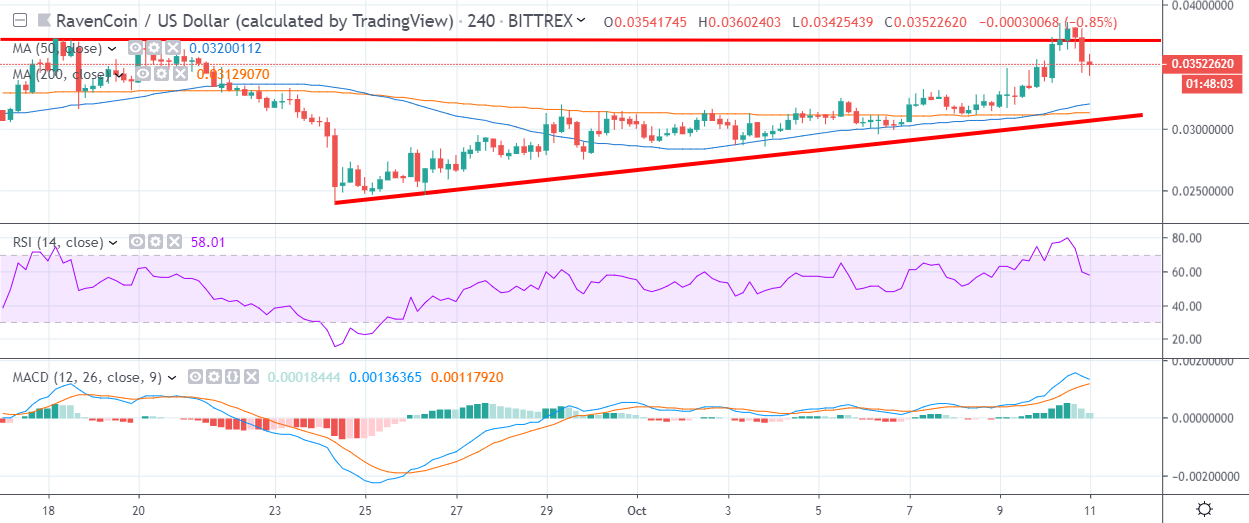
- The four-hour time shows that a bullish ascending triangle pattern has now formed
- The RVN / USD pair has been rejected from the neckline of a head and shoulders on the daily time frame
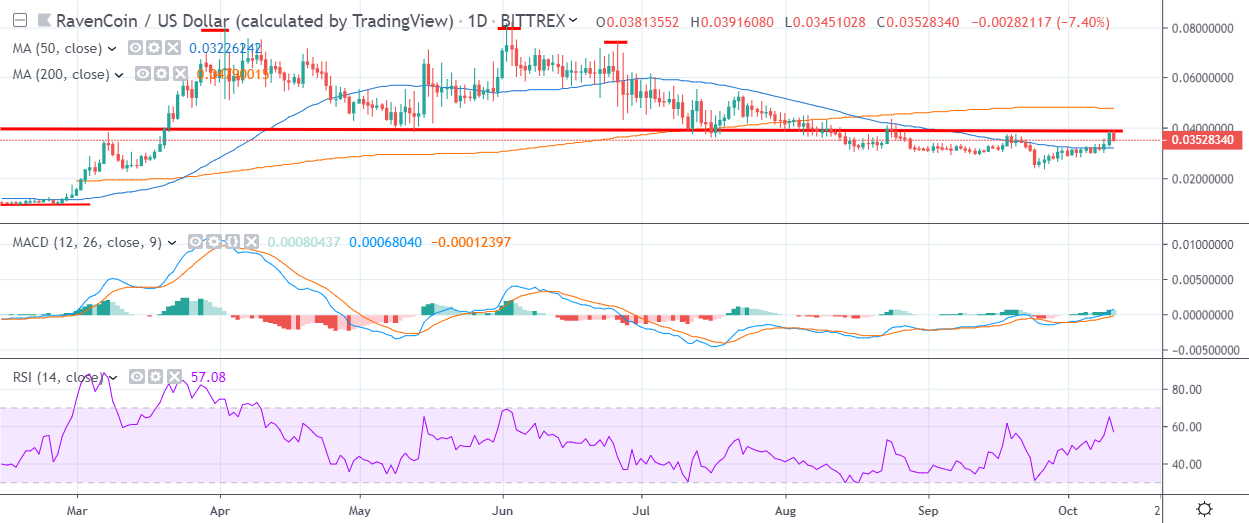
Ravencoin has undergone a bearish reversal after rallying to its highest trading level since late August. The RVN / USD pair has given back around ten percent of its trading value as the broader cryptocurrency market comes under pressure.
The RVN / USD pair has been one of the top performing digital assets inside the top 50 this month, with the cryptocurrency adding close to thirty-five percent to it value from its monthly price open to its monthly price peak.
The recent reversal in the RVN / USD pair happened at a critical technical area, as the cryptocurrency tested towards the neckline of a large head and shoulders pattern on the daily time frame.
The bearish pattern was triggered last month, leading to a sharp decline towards the $0.240000 level. The neckline of the head and shoulders pattern is currently located around the $0.370000 level.
Looking at the lower time frames, the early month rally has now created a bullish ascending triangle pattern on the four-hour time frame. The pattern suggests that the RVN / USD pair could rally towards the $0.470000 level if the pattern is fully ignited.
It is worth noting that that the RVN / USD pair would need to rally be close to one hundred percent to invalidate the head and shoulders pattern on the daily time frame.
According to the latest sentiment data from TheTIE.io, the short-term sentiment towards Ravencoin is neutral, at 56.50 %, while the overall long-term sentiment towards the cryptocurrency is also neutral, at 49.00%.
Upside Potential
The four-hour time frame highlights that the RVN / USD pair has now reclaimed its short-term bullish status. The 200-period moving average on the mentioned time frame is now located at the $0.307000 level.
The daily time frame highlights that the $0.370000 and $0.400000 levels are key upcoming resistance. It is worth noting that the pair’s 200-day moving average is currently located around the $0.470000 level.
Downside Potential
The four-hour time frame is showing that major short-term support for the RVN / USD pair is located at the $0.315000 and $0.307000 levels.
The daily time frame is showing that the RVN / USD pair’s 50-day moving average is located around the $0.317000 level, while major trendline resistance is found at the $0.303000 level.
Summary
Ravencoin is starting to come under minor technical selling pressure, after reaching levels not seen since late August this year.
The lower time frames are projecting that the recent rally in the RVN / USD pair may still have legs, with the $0.470000 level the likely short-term bullish target.
Check out our RavenCoin guide for insights.