
Ren Price Analysis REN / BTC: Breaking Out
The team's development update fueled up a bullish breakout.
- Ren has a bullish short-term bias against Bitcoin, with the REN / BTC pair testing back towards its current 2019 trading high
- The four-hour time frame shows that a bullish breakout is underway from a falling wedge pattern
- The daily time frame also shows that a major bullish breakout is underway in the REN / BTC pair
Fundamental Analysis
Ren gained momentum after the project’s July development update. The team is still improving and stabilizing the RenVM Testnet in preparation for its upcoming release. Overall, the project is growing well, and now is in the final stages before the Testnet will become available to the whole community.
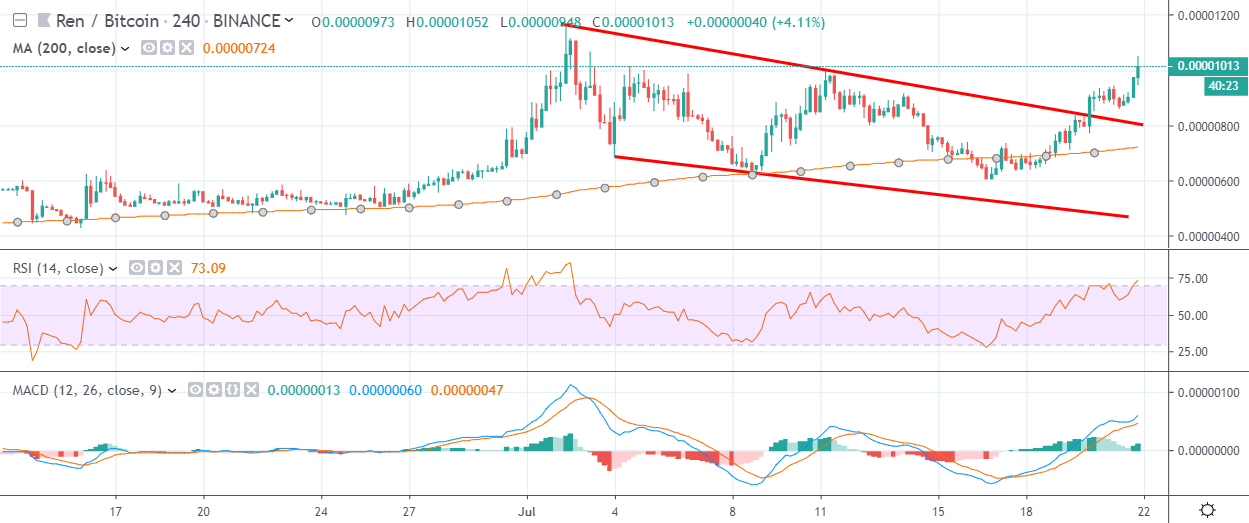
Ren / Bitcoin Short-term price analysis
Ren has a bullish short-term trading bias against Bitcoin, with the REN / BTC pair testing back towards its current 2019 trading high.
The four-hour time frame shows that the REN / BTC pair has now moved above a falling wedge pattern. The projected upside move of the bullish breakout would take the cryptocurrency to a new all-time trading high.
Technical indicators across the four-hour time horizon are bullish, although they are starting to appear overstretched to the upside.
Pattern Watch
Traders should note that falling wedge patterns are typically considered bullish and usually breakout in the direction of the prevailing trend.
Relative Strength Index
The Relative Strength Index on the four-hour time frame is bullish, although it is starting to appear overstretched.
MACD Indicator
The MACD indicator on the four-hour time frame is bullish and continues to generate a buy signal.
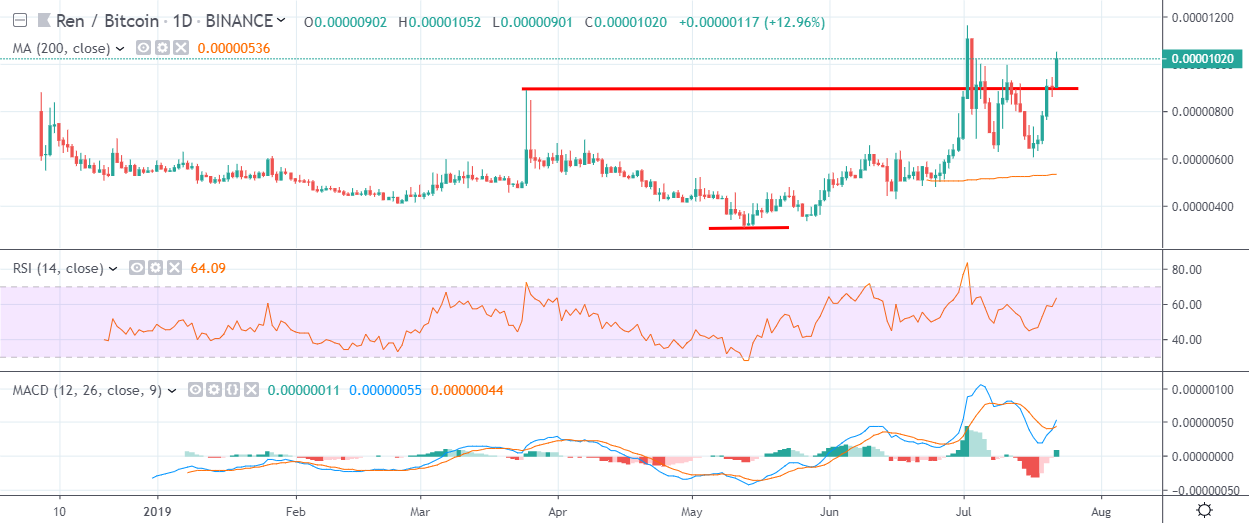
Ren / Bitcoin Medium-term price analysis
Ren has a bullish medium-term outlook against Bitcoin, with the REN / BTC pair rallying back above critical resistance on the daily time frame.
The daily time frame shows that the REN / BTC pair is trading back above the neckline of a large inverted head and pattern, following numerous false upside breakouts.
Technical indicators on the daily time frame are bullish and continue to issue a strong buy signal.
Pattern Watch
Traders should note that multiple daily price closes above the neckline of the bullish pattern may encourage the next round of technical REN / BTC buying.
Relative Strength Index
The RSI indicator is bullish on the daily time frame and shows scope for significant upside.
MACD Indicator
The MACD indicator is bullish on the daily time frame and is generating a strong buy signal.
Conclusion
Ren is starting to appear increasingly bullish across the four-hour and daily time frames, with both time horizons showing a bullish breakout in progress.
The key technical developments to watch over the coming trading sessions will be fresh higher highs and multiple daily price closes above key neckline support on the daily time frame.