
Ren Price Analysis REN / BTC: Testnet Excitement
Ren is making strong gains on testnet anticipation.
- Ren has a bullish short-term trading outlook against Bitcoin, with the REN / BTC pair trading at a new all-time high
- The four-hour time frame shows a series of invalidated head and shoulders patterns
- The daily time frame shows a newly created bullish inverted head and shoulders pattern
Fundamental Analysis
Ren is gaining momentum prior to the launch of RenVM Testnet. The team has spent a month focusing on improving its stability and is getting close to the actual release. This is an important milestone for the project, since it puts it closer to the launch of RenVM Mainnet.
Ren / Bitcoin Short-term price analysis
Ren has a bullish short-term trading outlook against Bitcoin, with the REN / BTC pair advancing to a new all-time price high.
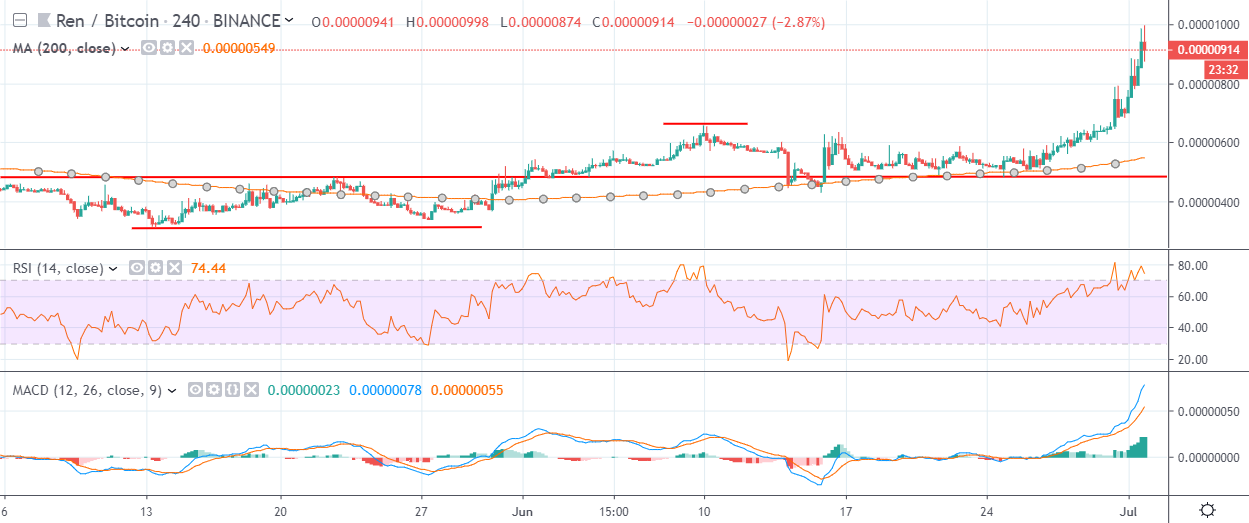
The four-hour time frame shows a series of invalidated head and shoulders patterns, with the REN / BTC pair already achieving its bullish invalidation target.
Technical indicators on the four-hour time frame are bullish and continue to issue a buy signal.
Pattern Watch
Traders should note that a technical correction may occur now that the REN / BTC pair has reached its upside objective in the short-term.
Relative Strength Index
The Relative Strength Indicator on the four-hour time frame is bullish, although it is trading in extreme overbought territory.
MACD Indicator
The MACD indicator on the four-hour time frame is bullish and continues to generate a strong buy signal.
Ren / Bitcoin Medium-term price analysis
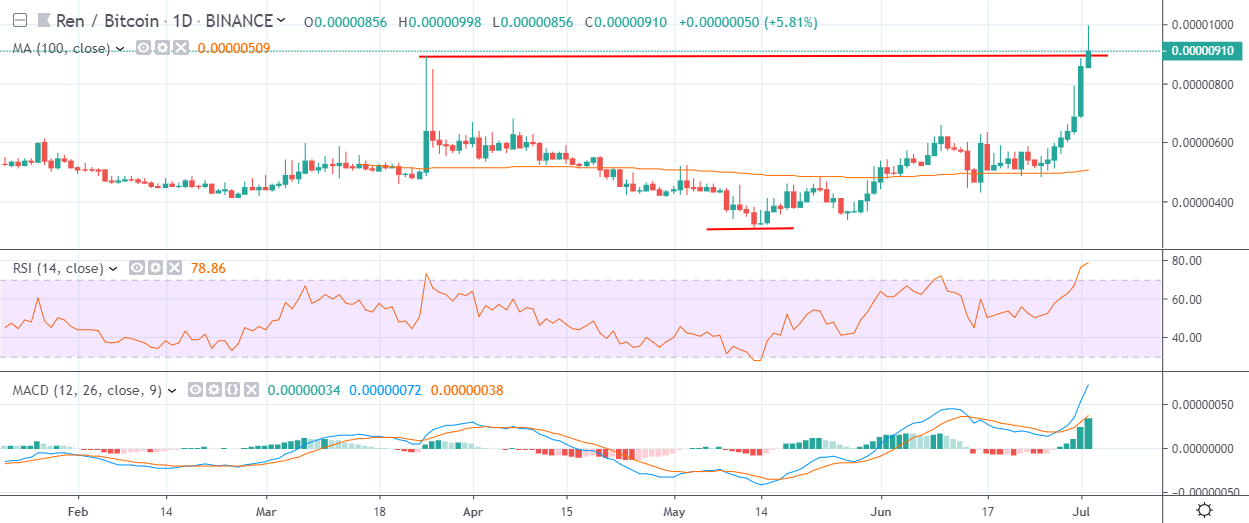
Ren has a bullish medium-term outlook against Bitcoin, with the REN / BTC pair performing a major technical breakout on the daily time frame.
The daily time frame shows that the recent advance in REN / BTC pair has created a large inverted head and shoulders pattern, with the cryptocurrency now trading above the neckline of the bullish pattern.
Technical indicators on the daily time frame are bullish and continue to generate a buy signal.
Pattern Watch
Traders should note that the overall target of the bullish pattern on the daily time frame would add more than seventy percent to the value of the REN / BTC pair.
Relative Strength Index
The RSI indicator is bullish on the daily time frame, although it is starting to appear overbought.
MACD Indicator
The MACD indicator is bullish on the daily time frame and is generating a strong buy signal.
Conclusion
Ren has enjoyed eight consecutive days of trading gains against Bitcoin, with the REN / BTC pair advancing to a new record all-time trading high.
The newly created bullish pattern on the daily time frame is warning that the REN / BTC pair could continue to make substantial gains over the medium-term.