
Ren Price Analysis REN / BTC: Return Of The Bulls
After a brief correction, it's ready to go back up.
- Ren has an increasingly bullish short-term trading bias against Bitcoin
- The four-hour time frame shows that the REN / BTC pair has performing a bullish breakout from a falling wedge pattern
- The daily time frame shows that the REN / BTC is recovering back above the neckline of a bullish inverted head and shoulders pattern
Ren / Bitcoin Short-term price analysis
Ren has a bullish short-term trading bias against Bitcoin, with the REN / BTC pair well-supported on any technical pullbacks.
The four-hour time frame shows that the cryptocurrency has performed a bullish breakout from a falling wedge pattern. Buyers are now attempting to move the REN / BTC pair back towards its all-time price high.
Technical indicators across the four-hour time horizon currently have a slight bullish bias.
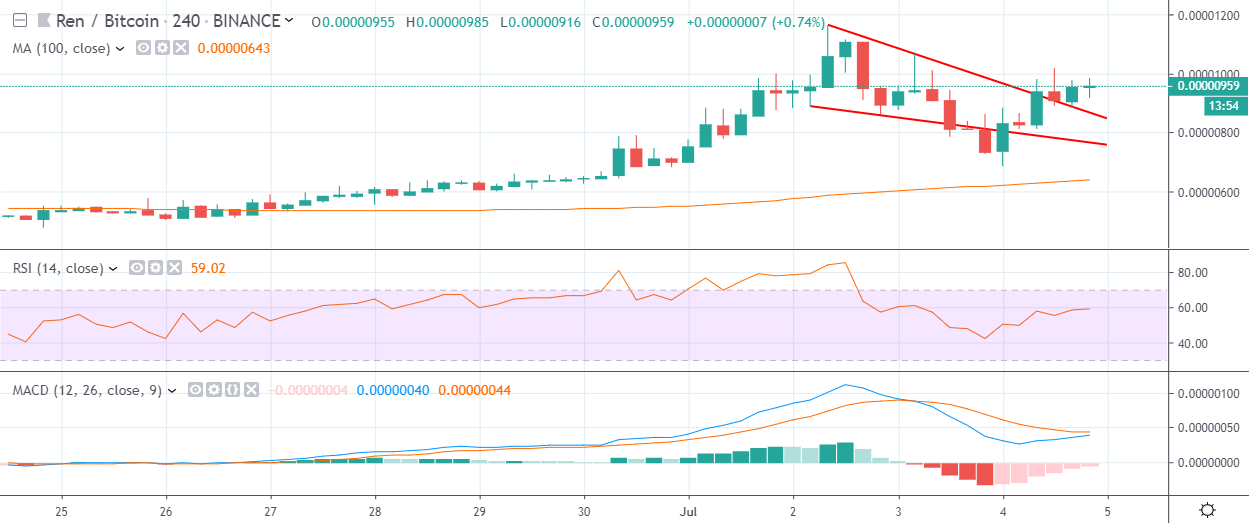
Pattern Watch
Traders should note that a bullish inverted head and shoulders pattern will form if the bulls move the REN / BTC pair back towards its all-time price high.
Relative Strength Index
The Relative Strength Indicator on the four-hour time frame is bullish, but it is generating a fairly weak buy signal.
MACD Indicator
The MACD indicator on the four-hour time frame is neutral and is currently failing to generate a clear trading signal.
Ren / Bitcoin Medium-term price analysis
Ren has a bullish medium-term outlook against Bitcoin, with the REN / BTC pair recovering back above key resistance on the daily time frame.
The daily time frame shows that the cryptocurrency has been extremely volatile since breaking above the neckline of an inverted head and shoulders pattern. Buyers are currently attempting to stabilize the REN / BTC pair back above the breakout point on the mentioned time frame.
Technical indicators on the daily time frame are bullish and continue to generate a buy signal.
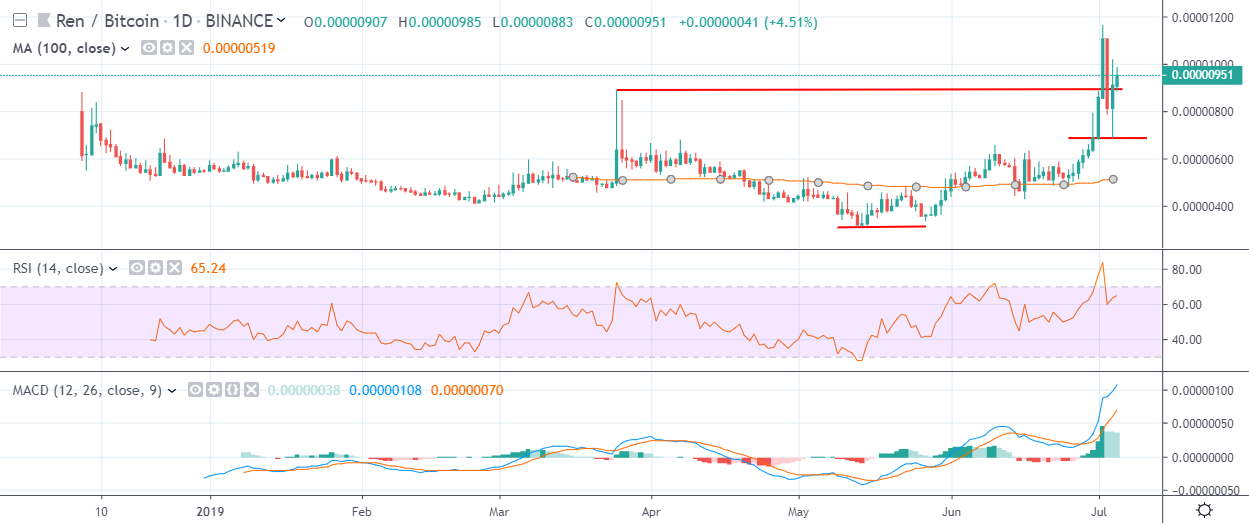
Pattern Watch
Traders should note that the bullish pattern on the daily time frame has yet to reach its full upside potential.
Relative Strength Index
The RSI indicator is starting to recover higher, following a much-needed technical correction.
MACD Indicator
The MACD indicator is bullish on the daily time frame and continues to generate a buy signal.
Conclusion
Ren is starting to recover above key technical resistance on the daily time frame against Bitcoin, following a period of extreme volatility.
If short-term buyers can move the cryptocurrency back towards its all-time price high it would provide a strong indication that the recent bullish breakout is back on-track.