
Ripple Price Analysis XRP / USD: Buying The Rumor
MoneyGram acquisition rumors caused a large price hike.
- Ripple has a bullish short-term trading bias, with the cryptocurrency still trading above its 200-period moving average on the four-hour time frame
- The four-hour time frame shows a bearish triple-top pattern formation
- The daily time frame continues to highlight that a confirmed bullish breakout is still underway
Ripple / USD Short-term price analysis
Ripple has a bullish short-term outlook, with the XRP / USD pair still holding price above its 200-period moving average on the four-hour time frame.
The four-hour time frame shows that the inverted head and shoulders pattern has reached its full upside objective. The mentioned time frame also shows that a bearish triple-top pattern has now formed.
Technical indicators across the four-hour time frame have turned bullish and continue to issue a strong buy signal.
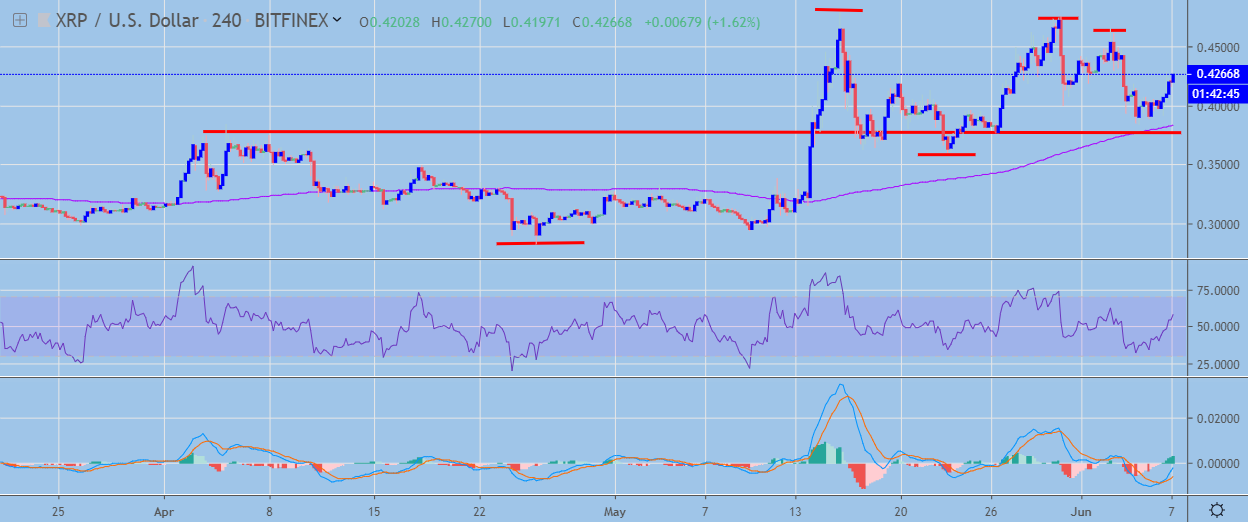 XRP / USD H4 Chart by TradingView
Pattern Watch
Traders should note that bulls need to move price above the 0.4700 level to negate the bearish pattern on the four-hour time frame.
Relative Strength Index
The RSI indicator is bullish on the four-hour time frame and shows scope for further upside.
MACD Indicator
The MACD indicator is bullish on the four-hour time frame, with both the MACD signal line and histogram issuing a strong buy signal
Fundamental Analysis
Ripple’s pump coincides with the rumor that the project has acquired major US-based money transfer company MoneyGram. Although both companies refused to comment, if the rumor is confirmed, this could be a major step for Ripple in getting worldwide recognition in the traditional markets.
Ripple / USD Medium-term price analysis
Ripple has a bullish medium-term trading outlook, with the XRP / USD pair still maintaining price above major technical support.
The daily time frame continues to show that the bullish technical breakout still remains valid, following a recent technical test of key trendline support.
Indicators on the daily time frame are mixed and are currently failing to issue a clear trading signal.
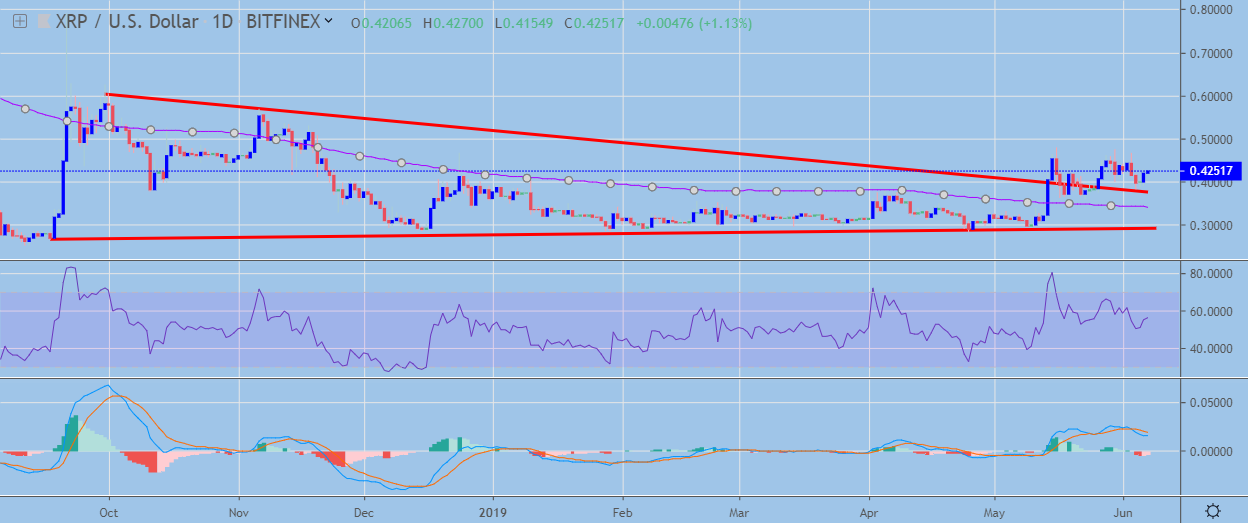 XRP / USD Daily Chart by TradingView
Pattern Watch
Traders should note that the XRP / USD pair has yet to reach the bullish target of the descending triangle pattern on the daily time frame, which is found at the 0.6000 level.
Relative Strength Index
The Relative Strength indicator on the daily time frame is also mixed, with the indicator trading around neutral levels.
MACD Indicator
The MACD indicator on the daily time frame is mixed and is failing to generate a clear trading signal.
Conclusion
Ripple continues to trade above major technical support on both time horizons, with the medium-term bullish breakout still very much in play.
Short-term bulls now need to invalidate the bearish triple-top pattern formation on the four-hour time frame to avoid a much deeper technical reversal.
Find out more about Ripple in our coin guide.
A deeper look into the merits of the project can be found in our DARE.