 Earn with Nexo

Ripple-Promoted Token Price Analysis XRP / USD: Weakening Positions
XRP has encountered heavy resistance.
- Ripple has a bearish short-term trading bias, with the XRP / USD pair remaining under technical selling pressure
- The head and shoulders pattern on the four-hour time frame has yet to reach its overall downside objective
- The daily time frame shows that the XRP / USD remains trapped inside a narrowing wedge pattern
Ripple / USD Short-term price analysis
Ripple has a bearish short-term trading outlook, with the XRP / USD pair still in downside breakout mode below key technical support.
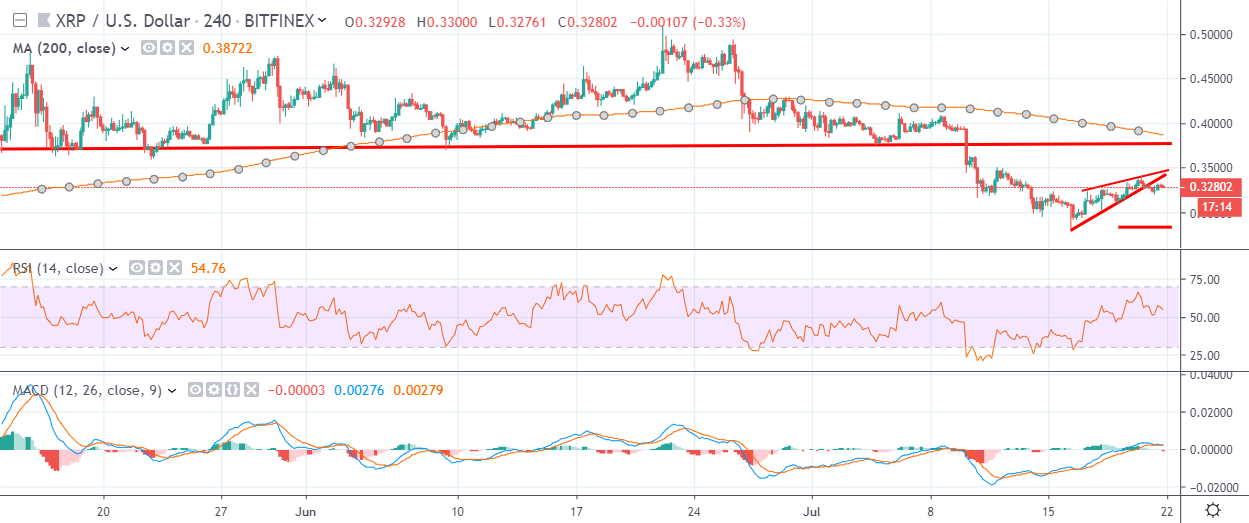
The four-hour time frame is showing that the bearish head and shoulders pattern breakout has yet to reach its full downside target. Sellers may start to test back towards the current monthly trading low if the XRP / USD pair starts to falter from current levels.
Major short-term resistance is located at the $0.3500 and $0.3850 levels.
Technical indicators across the four-hour time frame are starting to turn lower, although they remain technically bullish.
Pattern Watch
Traders should note that a rising wedge pattern is also seen on the four-hour time frame, with the XRP / USD pair now trading underneath the reversal pattern.
Relative Strength Index
The RSI indicator is turning lower on the four-hour time frame, although it remains technically bullish.
MACD Indicator
The MACD indicator is neutral on the four-hour time frame and is currently failing to generate a clear trading signal.
Ripple / USD Medium-term price analysis
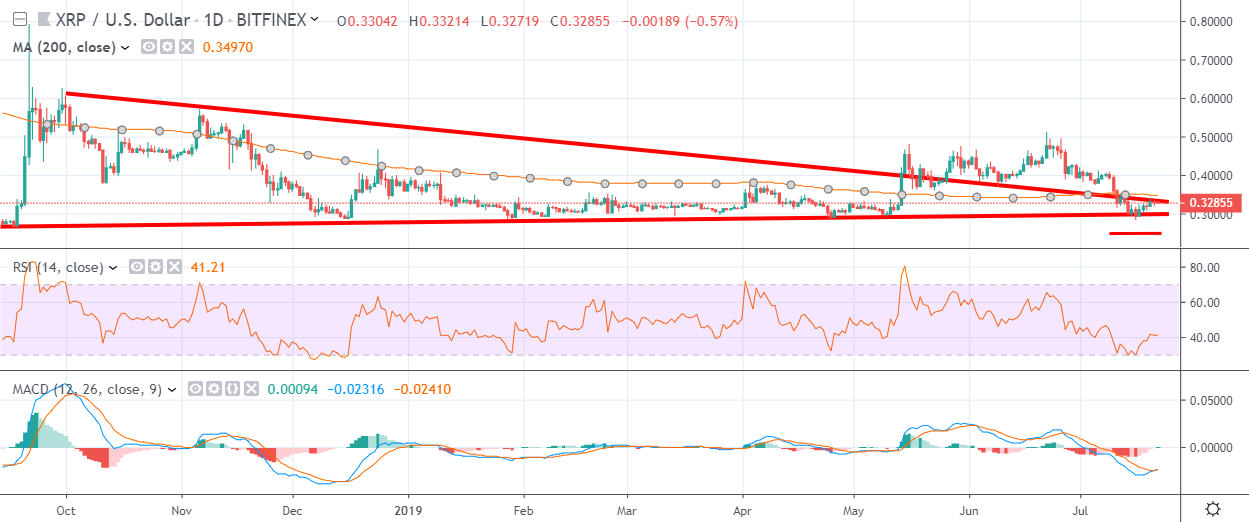
Ripple has a bearish medium-term outlook, with the XRP / USD pair trapped below its trend-defining 200-day moving average.
The daily time frame is showing that the XRP / USD pair has been consolidating inside a large wedge pattern. A bearish breakout from the wedge pattern supports a move lower towards at least the $0.2550 level, while a bullish breakout could target towards the $0.3850 level.
Technical indicators on the daily time frame are currently providing mixed trading signals.
Pattern Watch
The next strong directional move in the XRP / USD pair should occur once a confirmed breakout from the wedge pattern on the daily time frame occurs.
Relative Strength Index
The Relative Strength indicator on the daily time frame is bearish and continues to highlight growing weakness over the medium-term.
MACD Indicator
The MACD indicator on the daily time frame is attempting to turn bullish, although the indicator has yet to issue a clear buy signal.
Conclusion
Ripple is starting to lose short-term bullish momentum after finding strong technical resistance from the $0.3500 level, leaving the XRP / USD pair exposed to further downside moves back towards the $0.3000 level.
The bearish head and shoulders pattern has yet to reach its full downside target on the four-hour time, which may indicate further weakness ahead for the cryptocurrency.
Find out more about Ripple in our coin guide.
A deeper look into the merits of the project can be found in our DARE.