
Ripple-Promoted Token Price Analysis XRP / USD: On Sale
XRP remains under strong selling pressure.
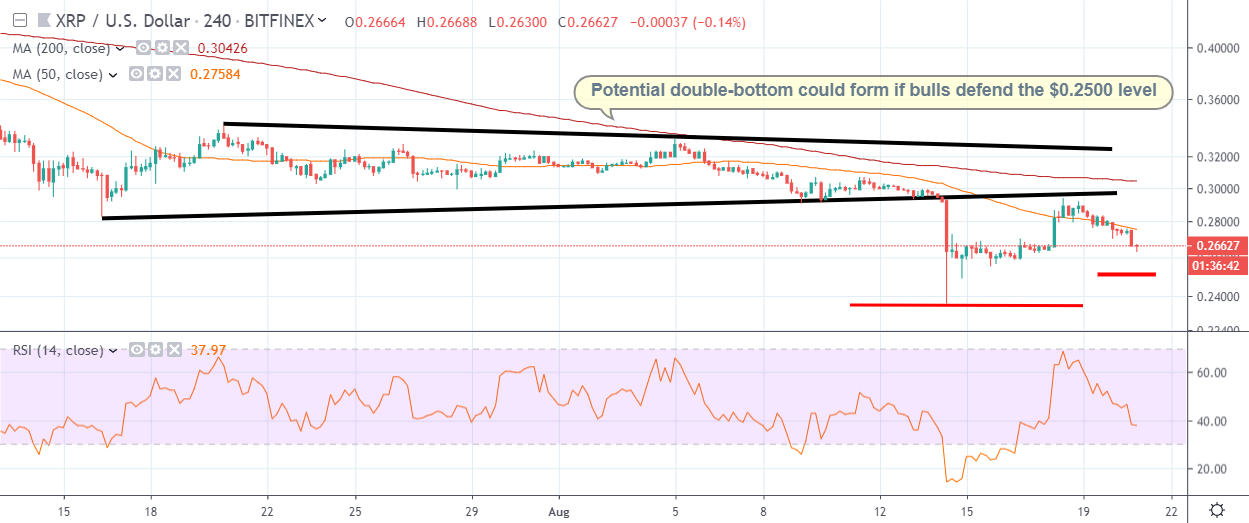
- Ripple is moving back towards the $0.2500 level after the third largest cryptocurrency suffered a technical rejection from the $0.2930 level
- Ripple buyers need to form a bullish double-bottom or a further decline towards the $0.2000 level is possible.
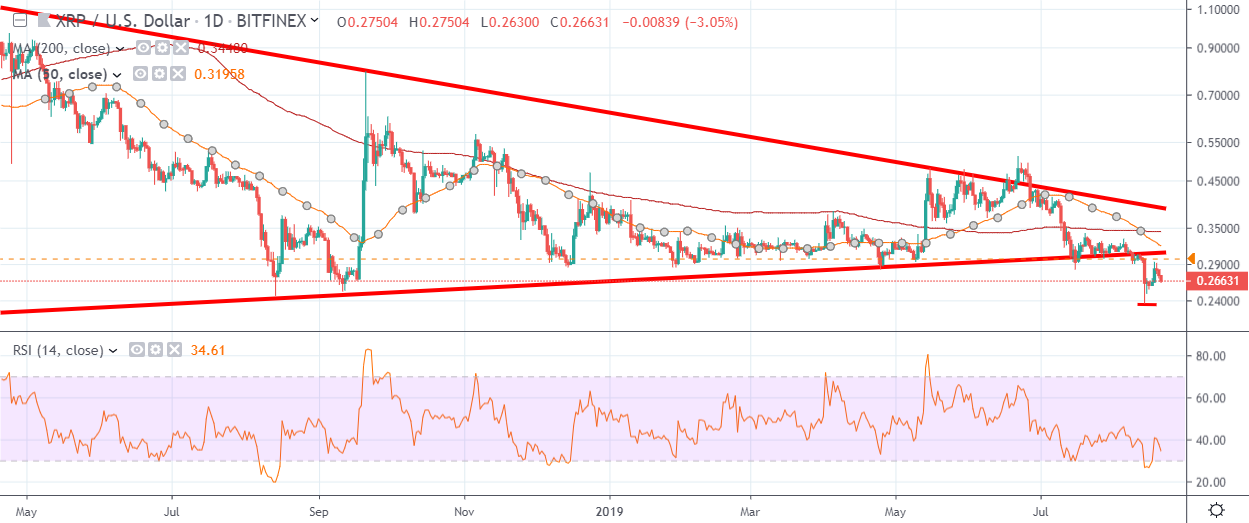
Ripple is back under selling pressure on Wednesday after the third largest cryptocurrency was swiftly rejected from the $0.2930 level earlier this week. The XRP / USD pair’s technical outlook worsened last week after a major bearish breakout below the $0.3000 level, which prompted a rapid technical sell-off towards the $0.2380 level.
Going forward, buyers need to defend the key $0.2500 level and form a bullish double-bottom pattern formation across the lower time frames to encourage short-term technical buying. Both the four-hour and daily time frames are showing that bulls need to move price above the $0.3050 to $0.3060 level to further stabilize the short-term sentiment towards the XRP / USD pair.
Currently there are few reasons to be bullish towards the XRP / USD pair until price moves above the $0.3050 to $0.3060 level as the overall short and medium-term trend for Ripple is overwhelmingly bearish. The $0.2380 level is key the area that sellers may soon attempt to break for an even greater decline towards the $0.2000 level.
A bearish death-cross is also underway on the daily time frame, while the RSI indicator on the daily time frame is still not oversold. These indicators are highlighting that the decline currently shows few signs of stopping, despite the XRP / USD suffering a thirteen percent decline in just over one week.
According to the latest sentiment data from TheTIE.io, the short-term sentiment towards Ripple is surprisingly bullish, at 57.00 %, while the overall long-term sentiment towards the cryptocurrency is bearish, at 38.17%.
Upside Potential
The four-hour time frame is showing that if bulls must break above rising trendline resistance from the $0.2950 level for further bullish advancement towards the $0.3050 area. The main short-term resistance area above the $0.3050 level is currently found at the August 5th swing-high, just below the $0.3300 level.
The daily time frame highlights the recent bearish breakout from the large triangle pattern has changed the technical landscape. Key technical resistance on the daily time frame comes from the psychological $0.3000 level and the pair’s trend-defining 200-day moving average, at $0.3200.
Downside Potential
The downside potential for the XRP / USD pair is unlikely to extend to far beyond the $0.2000 level if we do see the monthly trading low broken over the coming sessions. Selling upside technical corrections is still preferred as a bearish death-cross is currently underway, and the XRP / USD pair is still creating bearish lower highs.
The four-hour time frame shows that the XRP / USD pair has limited technical support under the $0.2500 level, while the daily time frame shows that the November 2017 trading low, around the $0.1890 level is the strongest form of support below the $0.2000 level.
Summary
Ripple is currently technically bearish across all time horizons, highlighting that the XRP / USD remains a strong sell until price recovers above the $0.3050 to $0.3060 levels.
Overall, a decline under the $0.2380 suggest that an even deeper fall towards the $0.2000 level appears increasingly likely.
Find out more about Ripple in our coin guide.
A deeper look into the merits of the project can be found in our DARE.