
Steem Price Analysis STEEM / USD: Pressured On All Sides
Consecutive lower tops and strong selling pressure paint a bleak picture.
- Steem has a bullish short-term outlook, with the STEEM / USD pair still holding above its 200-period moving average on the four-hour time frame
- The STEEM / USD pair has a neutral medium-term outlook, with price now consolidating around its 200-day moving average
- The daily time frame is showing that a large bearish head and shoulders pattern remains present.
Steem / USD Short-term price analysis
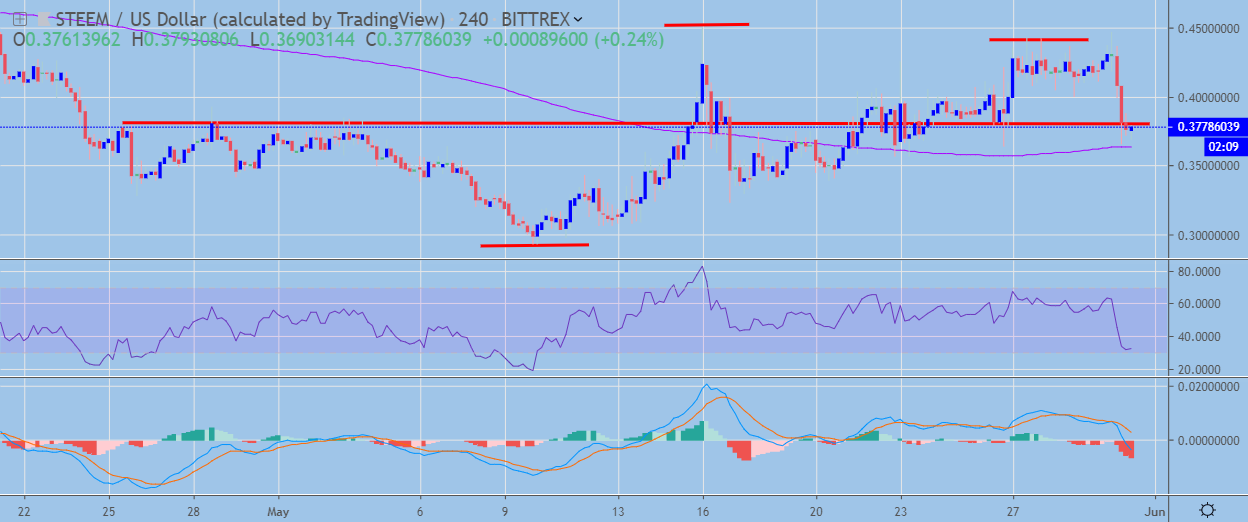
Steem has a bullish short-term trading outlook, with the cryptocurrency still holding above its 200-period moving average on the four-time frame.
The four-hour time frame is showing that an inverted head and shoulders has been triggered, with the bullish pattern twice failing to meet its overall upside objective.
Technical indicators on the four-hour time frame are bearish and show scope for further downside.
 STEEM / USD H4 Chart by TradingView
Pattern Watch
Traders should note that a bearish double-top price pattern is currently present on the four-hour time frame.
Relative Strength Index
The RSI indicator has turned bearish on the four-hour time frame, with the indicator still showing scope to trade lower.
MACD Indicator
The MACD indicator on the four-hour time frame has turned bearish and is currently generating a sell signal.
Steem / USD Medium-term price analysis
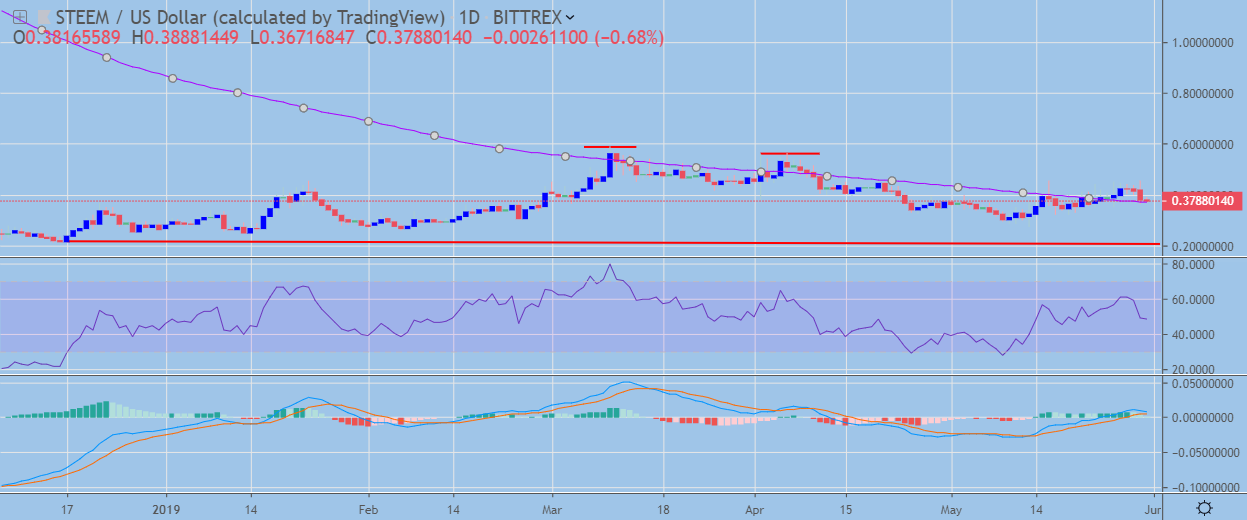
Steem has a neutral medium-term outlook, with the cryptocurrency now testing its trend defining 200-day moving average.
The daily time frame is showing that a complex head and shoulders pattern has formed, following STEEM / USD buyers inability to rally the cryptocurrency above the April trading high.
Technical indicators on the daily time frame remain bullish, although downside selling pressure is building.
 STEEM / USD Daily Chart by TradingView
Pattern Watch
Traders should note that a breach of the current monthly trading low could trigger a bearish breakdown towards neckline support.
Relative Strength Index
The Relative Strength indicator on the daily time is bearish and highlights the growing medium-term weakness in the STEEM / USD pair.
MACD Indicator
The MACD indicator on the daily time frame is bullish, although downside pressures are building.
Conclusion
Steem’s current inability to make new higher price highs is starting to weigh on its overall sentiment, with the sellers now probing towards its key 200-day moving average.
Continued weakness will further strengthen the medium-term bearish case for the STEEM / USD pair, with the formation of the complex head and shoulders pattern on the daily time frame offering a warning of the potential path ahead for the cryptocurrency.
For an introduction to the Steemit platform and its token, check out our coin guide.
If you need a deeper analysis of the fundamentals, we recently released our DARE for Steem.