
STEEM / USD Price Analysis: Bearish Double Top
The pair is losing Steem, with price descending along a steep price incline below its moving averages.
- Steem has a bearish short-term outlook, with the cryptocurrency now trading below its 200-period moving average on the four-hour time frame
- The STEEM / USD medium-term outlook is bearish, with price trading below the pair’s 200-day moving average
- The daily time frame is showing that a head and shoulders pattern is taking shape.
STEEM / USD Short-term price analysis
Steem has a bearish short-term outlook, with the cryptocurrency now trading below its 200-period moving average on the four-hour time frame.
The four-hour time frame is showing that a bearish double-top pattern is in play, with the Steem / USD pair giving back all of its hard-fought monthly trading gains.
Technical indicators on the four-hour time frame are bearish, following the steep decline in the Steem / USD pair.
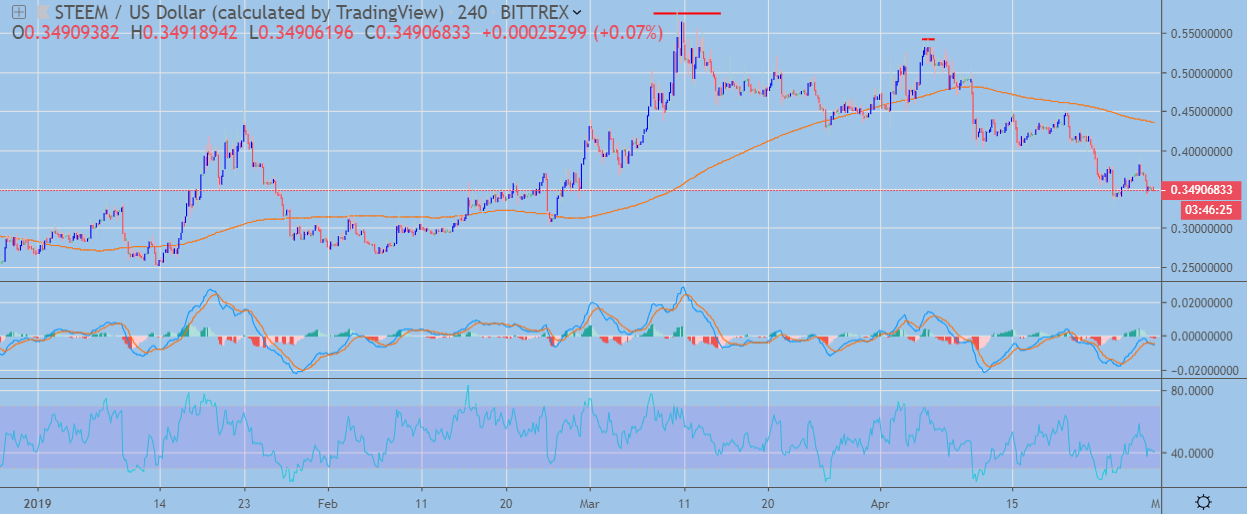 STEEM / USD H4 Chart by TradingView
Pattern Watch
Traders should note that a large head and shoulders pattern will form if the Steem / USD pair continues to decline towards the February 2019 trading low.
Relative Strength Index
The RSI indicator on the four-hour time frame is bearish, with the indicator still issuing a sell signal.
MACD Indicator
The MACD indicator on the four-hour time frame is currently neutral, with the indicator failing to generate a clear trading signal.
STEEM / USD Medium-term price analysis
Steem has a bearish medium-term outlook, with the cryptocurrency now trading below its trend defining 200-day moving average.
The daily time frame shows that the STEEM / USD pair is now making bearish lower lows and lower highs, while a large bearish pattern is also taking shape across the mentioned time frame.
Technical indicators on the daily time frame remain bearish and still have scope for further downside.
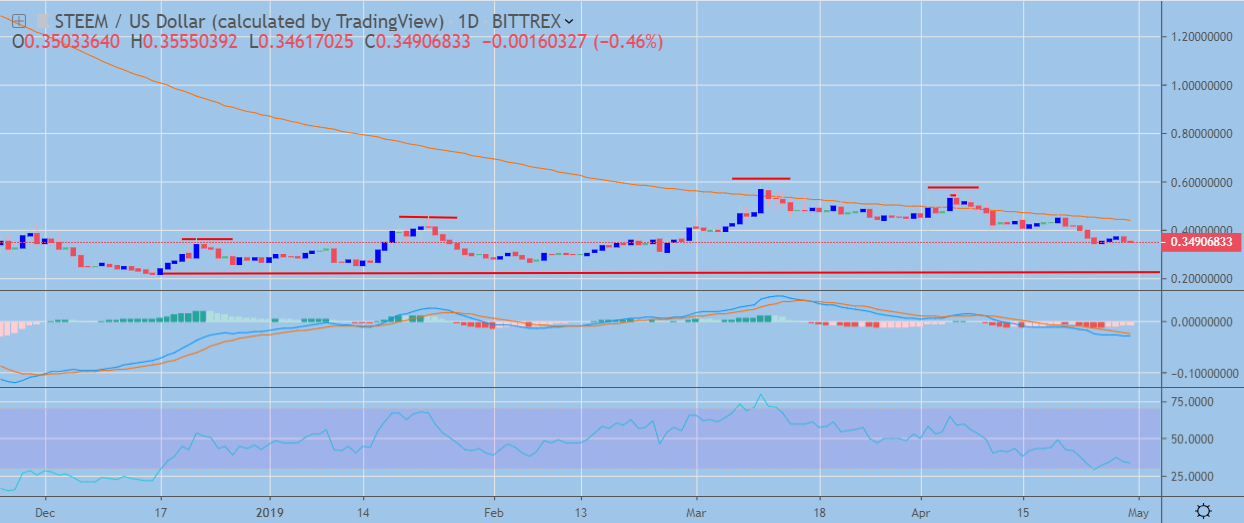 STEEM / USD Daily Chart by TradingView
Pattern Watch
Traders should note that a bearish double-top pattern has also formed across the daily time frame.
Relative Strength Index
The Relative Strength Index on the daily time is bearish and shows scope for further downside.
MACD Indicator
The MACD indicator on the daily time frame remains bearish, with the MACD signal line continuing to issue a sell signal.
Conclusion
Steem has now turned bearish over the short and medium-term, with the sharp decline in the cryptocurrency currently showing few signs of stopping.
The emergence of bearish head and shoulders patterns on the four-hour and daily time frames could place the STEEM / USD pair under even greater downside pressure.
For a quick look into Steemit and STEEM, check out our coin guide here.
If you need a deeper analysis, look into our Steem DARE.