 Earn with Nexo

Stellar Lumen Price Analysis XLM / USD: Collapsing Star
XLM could establish a fresh all-time trading low.
- Stellar Lumen has an increasingly bearish short-term trading bias, with the XLM / USD pair slipping towards its all-time trading low
- The four-hour time frame shows that a bearish triangle pattern breakout is underway
- The daily time frame shows that a bearish head and shoulders pattern has been triggered
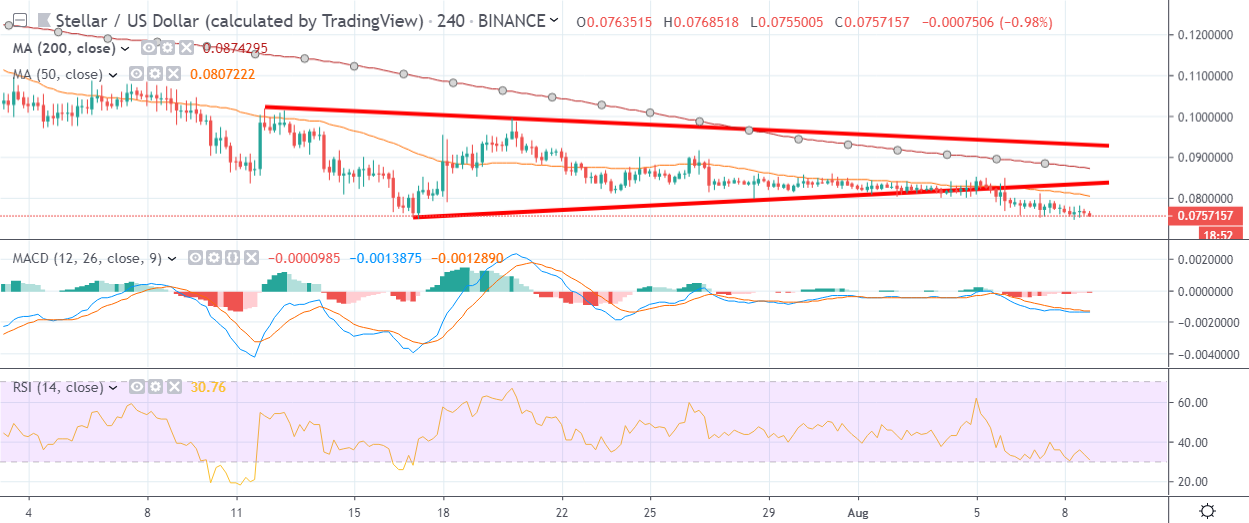
Stellar Lumen / USD Short-term price analysis
Stellar Lumen has a bearish short-term outlook, with the cryptocurrency slipping closer to its all-time trading low.
The four-hour time frame is showing that XLM / USD pair has performed a bearish breakout from a triangle pattern. The mentioned time frame also highlights that price is making bearish lower highs and lower lows.
Technical indicators are bearish on the four-hour time frame and continue to issue a sell signal.
Pattern Watch
Traders should note that the XLM / USD pair could decline a further ten percent according to the downside projection of the triangle pattern breakout.
Relative Strength Index
The RSI indicator is bearish on the four-hour time frame, although it has reached oversold territory.
MACD Indicator
The MACD indicator is bearish on the four-hour time frame and is currently generating a strong sell signal.
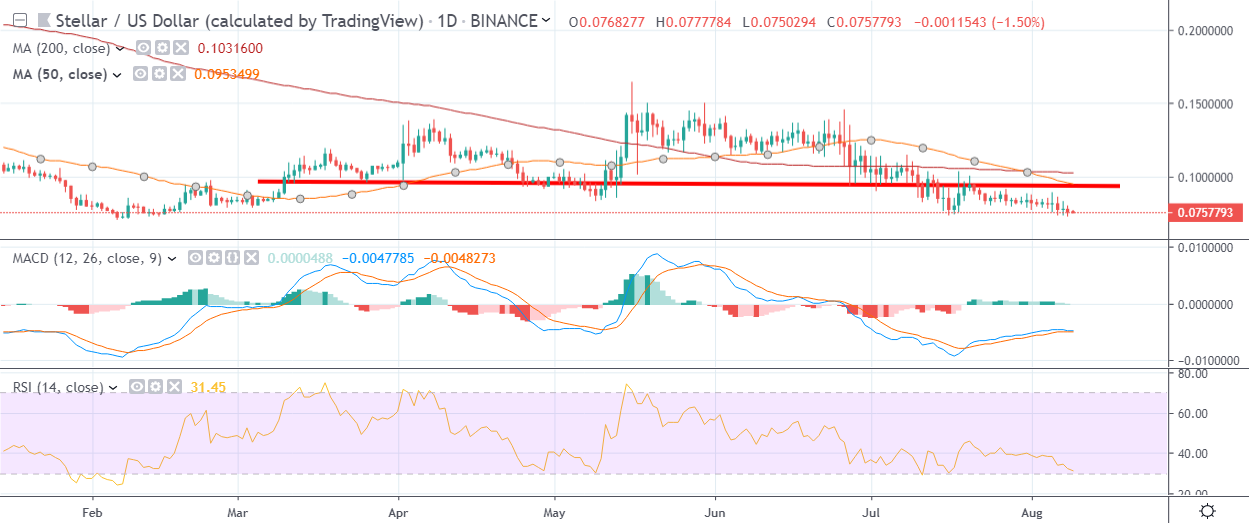
Stellar Lumen / USD Medium-term price analysis
Stellar Lumen has a bearish medium-time outlook, with the XLM / USD pair under severe technical pressure on the daily time frame.
The daily time frame shows that a bearish head and shoulders pattern has been triggered, while the 50-day moving average has crossed under the 200-day moving average.
Technical indicators on the daily time frame remain bearish and continue to issue sell signals.
Pattern Watch
Traders should watch for an increase in bearish momentum now that the head and shoulders pattern has been triggered.
Relative Strength Index
The RSI indicator is bearish on the daily time frame and is now approaching oversold territory.
MACD Indicator
The MACD indicator is bearish on the daily time frame and is currently issuing a weak sell signal.
Conclusion
Stellar Lumen is coming under increasing downside pressure across both time frame as the technicals for the cryptocurrency continue to worsen.
The bearish patterns on the four-hour and daily time frames highlight that the XLM / USD pair could eventually fall to a fresh all-time trading low.
Check out our coin guide for XLM.
Our analyst team also covered Stellar, offering a deep look into the project.