 Earn with Nexo

Stellar Lumen Price Analysis XLM / USD: High Targets
XLM has a lot of upside potential, but needs to meet certain goals.
- Stellar Lumen has a bullish short-term trading bias, but remains bearish over the medium-term
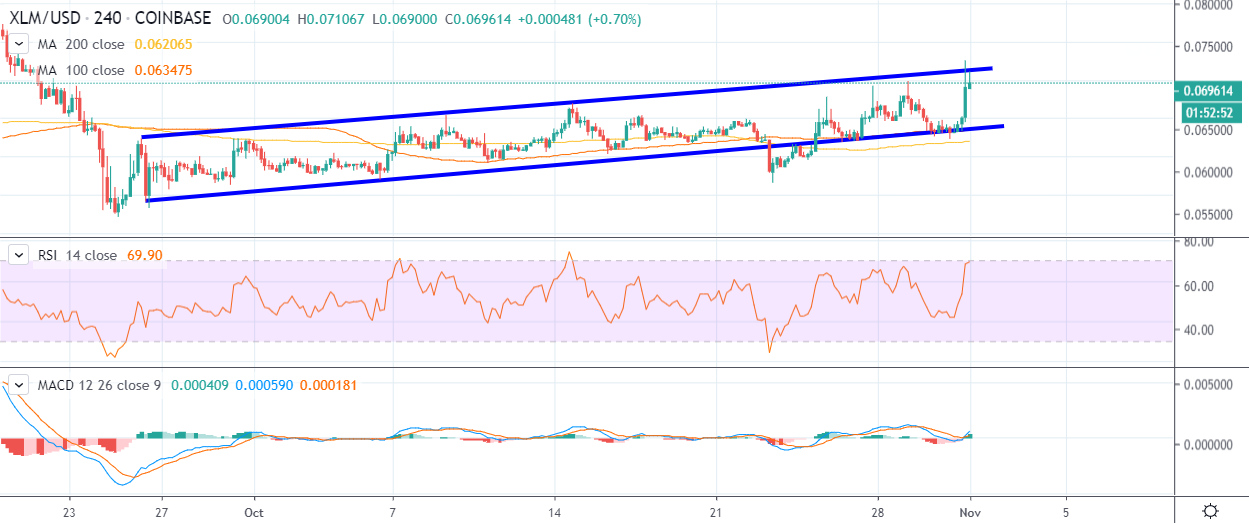
- The four-hour time frame shows that the XLM / USD pair is trading in a rising price channel
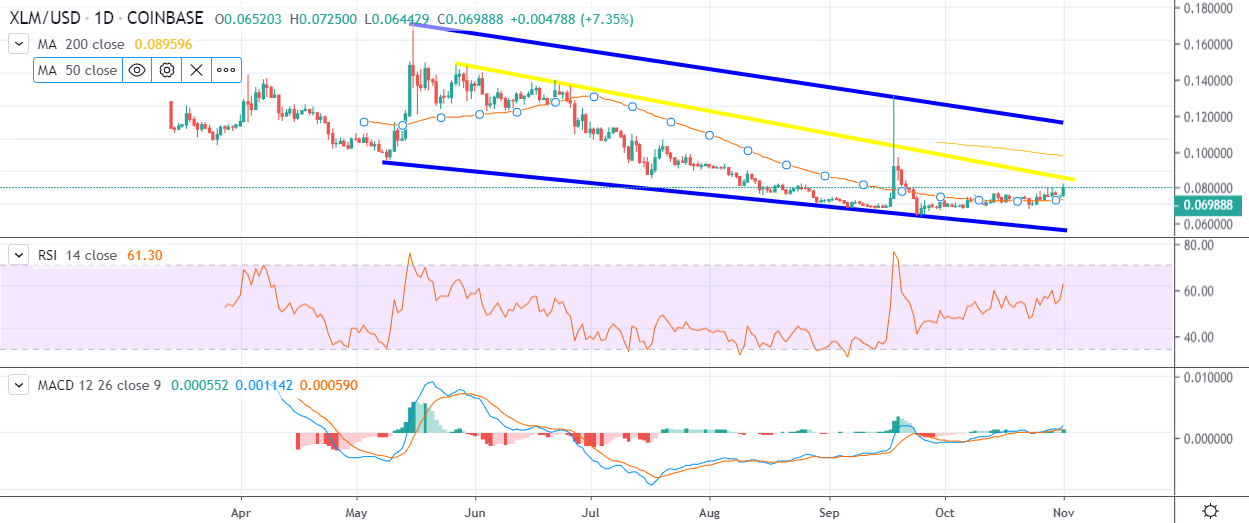
- The daily time frame shows that a large descending price channel has formed
Stellar Lumen is on the rise, after the cryptocurrency posted strong double-digit trading gains over the last twenty-four hours and rose to its highest trading level since late September this year.
At current trading levels, the XLM / USD pair has posted an impressive gain of around thirty percent from the September monthly trading low. Although it is worth noting that the cryptocurrency remains around 50% off its 2019 price peak.
The short-term technicals for the XLM / USD pair have improved over the last few weeks and currently show that a possible advance towards the $0.080000 level could be on the cards.
The four-hour time frame shows that the cryptocurrency is currently trapped within a rising price channel. The mentioned time frame shows that a break above the $0.070000 level could spark a further $0.010000 advance in the XLM / USD pair.
The daily time frame currently shows that a declining price channel has formed, with price fast approaching the midpoint of the bullish price channel.
The top of the price channel is located around the $0.100000 level and remains a valid upside target if a break above the midpoint of the price channel occurs.
According to the latest sentiment data from TheTIE.io, the short-term sentiment towards Stellar Lumen is bullish, at 60.00 %, while the overall long-term sentiment towards the cryptocurrency is bearish, at 20.00%.
Upside Potential
The four-hour time frame shows that a rising price channel has formed, with the top of the price channel located around the $0.072000 level.
Key resistance for the XLM / USD pair on the daily time frame is currently located at the $0.080000 and the $0.100000 levels.
Downside Potential
The four-hour time frame is showing that the $0.062000 level is providing the strongest form of short-term technical support below the pivotal $0.068000 level.
The daily time frame highlights that the XLM / USD pair’s 50-day moving average is now acting as critical support at the $0.682000 level. Key trendline support below the 50-day moving average is found at the $0.060000 level.
Summary
Stellar Lumen has further upside potential in the short-term if the cryptocurrency can stage a breakout rally above the $0.072000 level.
The daily time frame highlights that the $0.100000 level remains a likely medium-term upside objective.
Check out our coin guide for XLM.
Our analyst team also covered Stellar, offering a deep look into the project.