−2.9% (FY ended 2025-12-31 vs FY ended 2024-12-31) 10-K
Annual net income
3,794,000,000 USD (FY ended 2025-12-31, attributable to the company) 10-K
Annual operating margin
4.6% (FY ended 2025-12-31)
Forward P/E
Unavailable: no dated forecast source
Gloria daily close for session Oct 28, 2026. Market cap and trailing P/E use this close with the SEC share total and trailing diluted earnings, each dated next to its figure. Annual revenue, revenue growth, net income and margin show their own fiscal period and link the 10-K. Current context may postdate this article.
Tesla Inc. and its peers
Company
Price
Market cap
P/E (trailing)
Forward P/E
Annual revenue (USD)
Annual revenue growth
Annual net income (USD)
Operating margin
Tesla Inc.
TSLA · Price dated Oct 28, 2026 · tokenized TSLAx
−3,646,000,000FY ended 2025-12-31, attributable to the company · 10-K
−66.5%FY ended 2025-12-31
Missing figures stay unavailable. Forward P/E requires a dated source. Annual revenue, revenue growth, net income and margin come from each company's own 10-K, in US dollars, and each row shows that fiscal year. Revenue growth compares the fiscal year with the prior year stated in the same 10-K. Net income is the full year amount attributable to the company, or available to common stockholders where the filing states only that, or consolidated net income. Each row names its basis. Trailing P/E reads "Not meaningful" when the dated trailing diluted EPS is a loss or zero. An operating margin appears only when the filing states both the operating income and the revenue for the same year.
Sources: SEC filings, Gloria daily closes, CoinGecko and Databento. Oldest record refresh: Oct 28, 2026, 4:31 PM EDT. Refresh is not a price or filing date. Each row shows its price date and its annual fiscal period. Peers use industry code and company size, or editorial selection. Market cap multiplies that row price by the company share total the latest SEC filing states for every share class together. Trailing P/E divides it by trailing diluted earnings from SEC filings. Rolled earnings per share are approximate because share counts can change between periods. Both appear only when the SEC data carries its date, so they are estimates at one price date, not synchronized filing valuations. Not investment advice.
Token vs underlying stock
Current comparison for TSLA. Historical observations may postdate this article.
Split-adjusted regular-session stock closes from the existing Gloria shared history, paired only with an observed token price within 45 minutes of 16:00 New York time. Up to 60 matched sessions. No interpolation or missing-date fill. Weekends and known early closes are omitted. Token units are not adjusted for issuer multipliers or dividend treatment. This compares quoted prices, not fair value, executable premiums or arbitrage returns. Solid line: token. Dashed line: stock. Exact quote times and values appear below. Historical observations. Retrieval refers to the token source. Token quote times use UTC. The fixed cohort shows its oldest member fetch.
Tesla token vs Tesla stock: exact source values
Date (UTC)
Token (USD)
Stock close (USD)
Token quote (UTC)
2026-08-05
321.77
321.55
2026-08-05 20:00
2026-08-06
319.34
319.53
2026-08-06 20:00
2026-08-07
328.56
328.58
2026-08-07 20:00
2026-08-10
330.41
330.88
2026-08-10 20:00
2026-08-11
332.57
332.81
2026-08-11 20:00
2026-08-12
327.33
327.51
2026-08-12 20:00
2026-08-13
339.84
339.96
2026-08-13 20:00
2026-08-14
342.19
342.27
2026-08-14 20:00
2026-08-17
339.31
339.30
2026-08-17 20:00
2026-08-18
336.76
336.87
2026-08-18 20:00
2026-08-19
350.81
351.12
2026-08-19 20:00
2026-08-20
344.93
345.13
2026-08-20 20:00
2026-08-21
363.21
362.86
2026-08-21 20:00
2026-08-24
349.40
348.95
2026-08-24 20:00
2026-08-25
350.44
350.25
2026-08-25 20:00
2026-08-26
345.96
345.82
2026-08-26 20:00
2026-08-27
354.49
354.81
2026-08-27 20:00
2026-08-28
348.43
348.75
2026-08-28 20:00
2026-08-31
368.11
367.95
2026-08-31 20:00
2026-09-01
356.26
356.09
2026-09-01 20:00
2026-09-02
356.40
357.01
2026-09-02 20:00
2026-09-03
376.26
376.37
2026-09-03 20:00
2026-09-04
353.98
354.08
2026-09-04 20:00
2026-09-08
367.67
368.16
2026-09-08 20:00
2026-09-09
367.89
367.81
2026-09-09 20:00
2026-09-10
363.21
363.56
2026-09-10 20:00
2026-09-11
365.20
365.44
2026-09-11 20:00
2026-09-14
358.97
358.97
2026-09-14 20:00
2026-09-15
356.15
356.58
2026-09-15 20:00
2026-09-16
357.92
358.08
2026-09-16 20:00
2026-09-17
366.16
366.20
2026-09-17 20:00
2026-09-18
364.26
364.27
2026-09-18 20:00
2026-09-21
375.33
375.30
2026-09-21 20:00
2026-09-22
378.85
378.90
2026-09-22 20:00
2026-09-23
379.78
380.12
2026-09-23 20:00
2026-09-24
378.18
377.94
2026-09-24 20:00
2026-09-25
372.41
372.11
2026-09-25 20:00
2026-09-28
357.86
357.45
2026-09-28 20:00
2026-09-29
352.87
352.84
2026-09-29 20:00
2026-09-30
354.55
354.81
2026-09-30 20:00
2026-10-01
354.60
354.11
2026-10-01 20:00
2026-10-02
370.48
370.59
2026-10-02 20:00
2026-10-05
378.53
378.73
2026-10-05 20:00
2026-10-06
380.33
380.68
2026-10-06 20:00
2026-10-07
377.65
377.81
2026-10-07 20:00
2026-10-08
374.64
375.00
2026-10-08 20:00
2026-10-09
382.68
382.70
2026-10-09 20:00
2026-10-12
377.87
378.03
2026-10-12 20:00
2026-10-13
375.78
375.23
2026-10-13 20:00
2026-10-14
366.65
367.16
2026-10-14 20:00
2026-10-15
362.70
362.44
2026-10-15 20:00
2026-10-16
354.41
354.72
2026-10-16 20:00
2026-10-19
368.02
368.06
2026-10-19 20:00
2026-10-20
373.65
373.71
2026-10-20 20:00
2026-10-21
386.28
386.47
2026-10-21 20:00
2026-10-22
376.50
374.58
2026-10-22 20:00
2026-10-23
372.40
372.22
2026-10-23 20:00
2026-10-26
391.19
391.62
2026-10-26 20:00
2026-10-27
406.70
407.46
2026-10-27 20:00
2026-10-28
404.39
404.22
2026-10-28 20:00
Stock history: Gloria · Retrieved Oct 29, 00:32 UTC. Token history: CoinGecko TSLAx.
Quoted token and share units can have different rights, multipliers and dividend treatment. This is not an executable premium or arbitrage signal.
Tesla sold 77% more vehicles across the European Union in the first five months of 2026 compared to the same period last year, according to data from the European Automobile Manufacturers’ Association (ACEA). The rebound is notable because it follows more than a year of declining sales across the region through much of 2025.
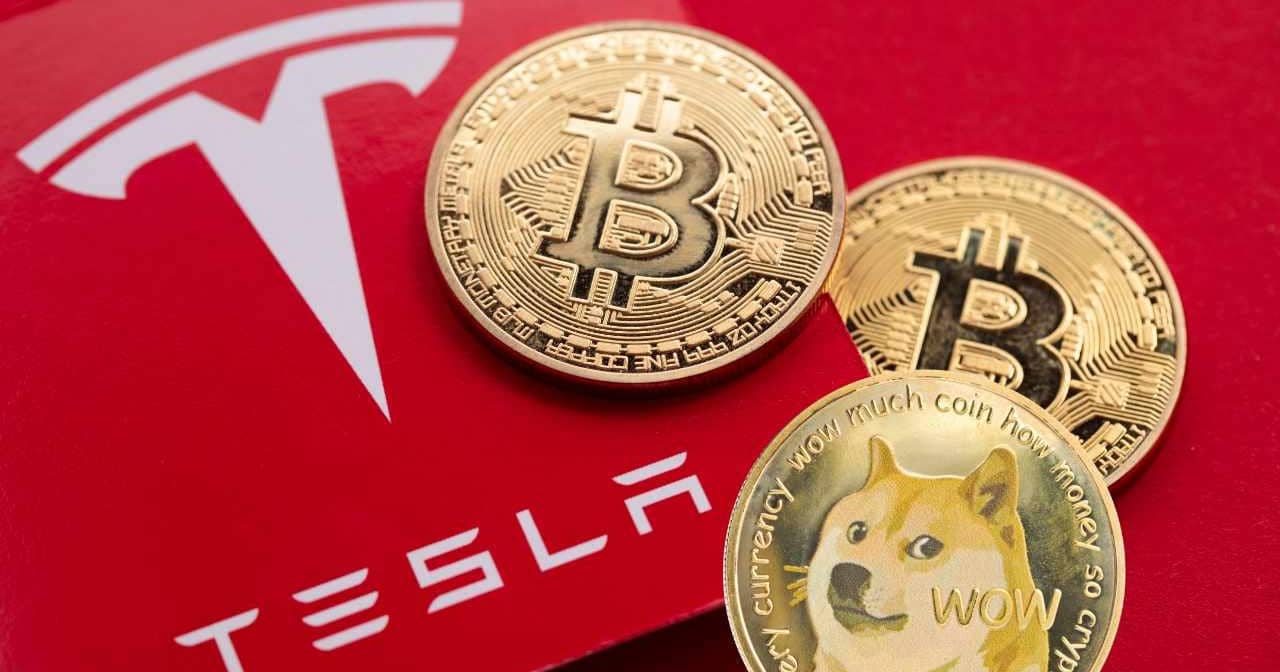
May alone accounted for 22,000 units sold across Europe. That figure matters not just for the EV market but for crypto markets too, because Tesla remains one of the largest publicly traded companies with a meaningful Bitcoin position on its balance sheet.
The European comeback in context
To appreciate how significant a 77% jump is, consider that the broader EU new-car market grew just 4% year-over-year during the same five-month window. Tesla didn’t merely ride a rising tide. It dramatically outpaced the market.
A recent selloff wiped out over $220 million in unrealized value from Tesla’s Bitcoin holdings. In English: Tesla didn’t lose cash, but on paper, its treasury got significantly lighter in a matter of days.
Tesla first bought Bitcoin back in early 2021, eventually accepting it as payment for vehicles before reversing that decision over environmental concerns. The company sold a significant portion of its holdings in 2022. What remains, the 11,509 BTC, represents a deliberate choice to maintain exposure to digital assets without actively trading them.
The company also accepts Dogecoin for certain merchandise purchases. Elon Musk’s well-documented enthusiasm for Dogecoin has made Tesla a cultural bridge between traditional industry and the crypto ecosystem.
Why car sales and crypto collide on Tesla’s books
Most automakers don’t have this problem. When Ford or Volkswagen reports quarterly results, nobody asks about their Bitcoin exposure. Tesla is unique because its balance sheet is essentially a hybrid: part industrial manufacturer, part crypto holder.
The 77% European surge provides exactly the kind of fundamental cushion that Tesla needs right now. If the company can demonstrate sustained demand recovery in one of the world’s largest car markets, the Bitcoin treasury becomes a side story rather than the main narrative.
Disclosure: This article was edited by Editorial Team. For more information on how we create and review content, see our Editorial Policy.