Tezos Breaks Above Multi-Year Resistance, Rally Setup
XTZ could continue to rise without too much resistance.
Tezos broke above a significant price barrier, which was previously keeping its price contained. Moving above this resistance could set the stage for a major bull run.
Tezos Reaches a New All-Time High
Over the last 24 hours, Tezos surged by nearly 24%. The bullish impulse allowed it to finally turn the $1.80 resistance level into support. This significant price hurdle was preventing XTZ from reaching higher-highs since September 2018, when the token was launched. Now, it seems like Tezos could be preparing for a parabolic move.
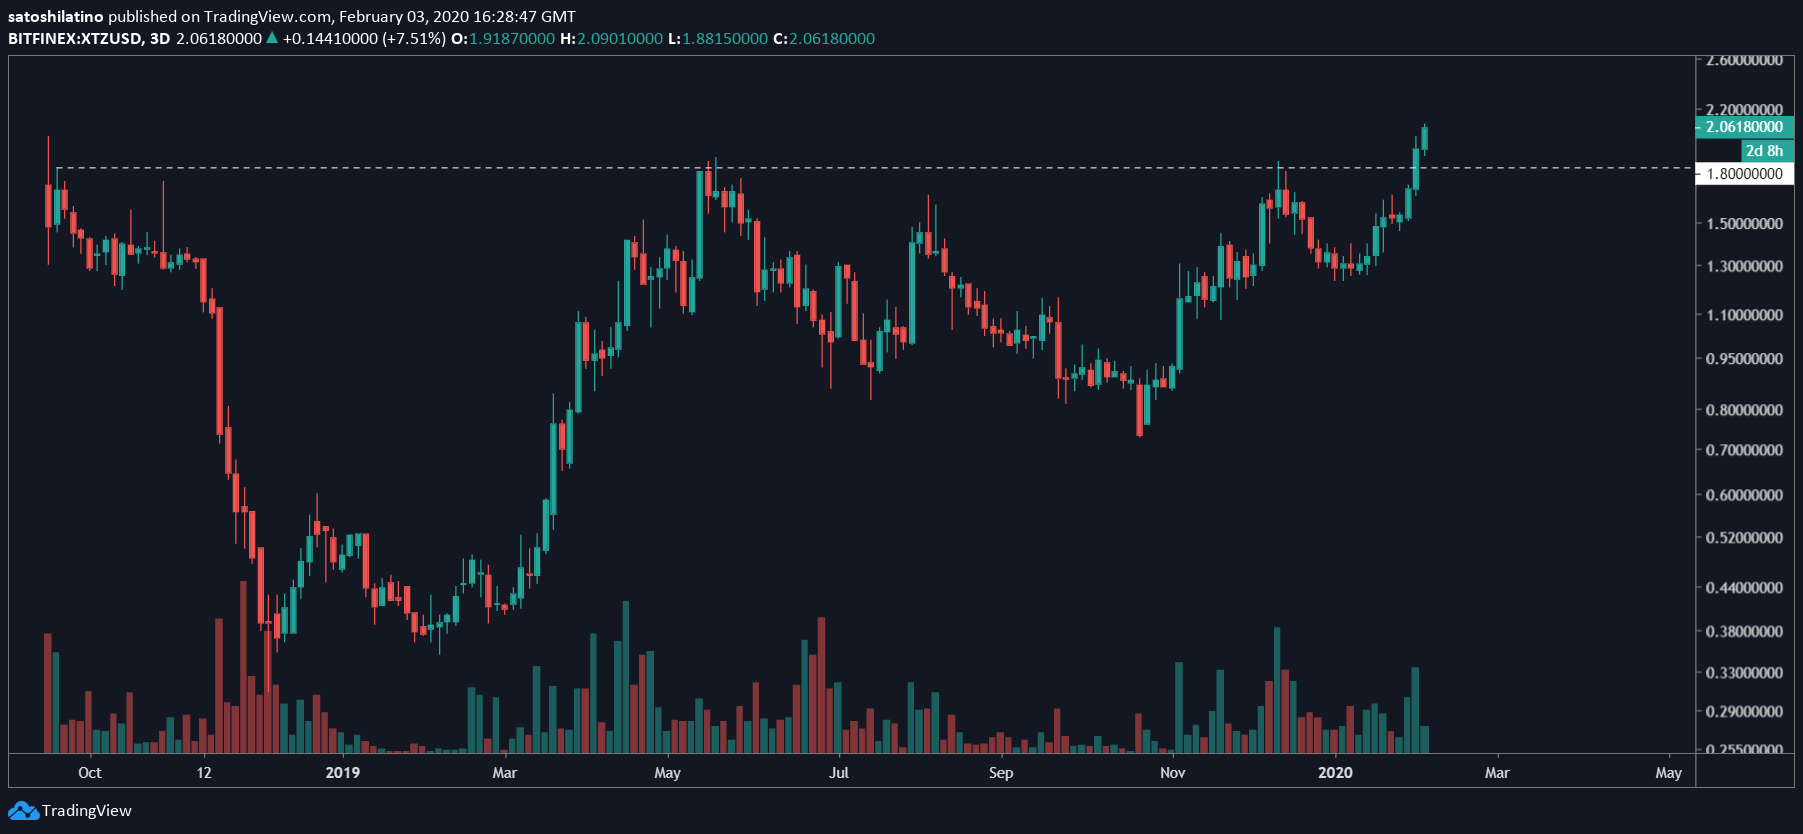
As a matter of fact, an inverse head-and-shoulders pattern appears to have developed on XTZ’s 3-day chart. This technical formation estimates a momentum reversal from bearish to bullish. The recent move above the $1.80 resistance level, also known as the neckline, could be the catalyst for a substantial price increase.
This bullish pattern projects a 60% surge that could take the price of Tezos to $2.90. This target is determined by measuring the distance between the head and the neckline and adding it to the breakout point.
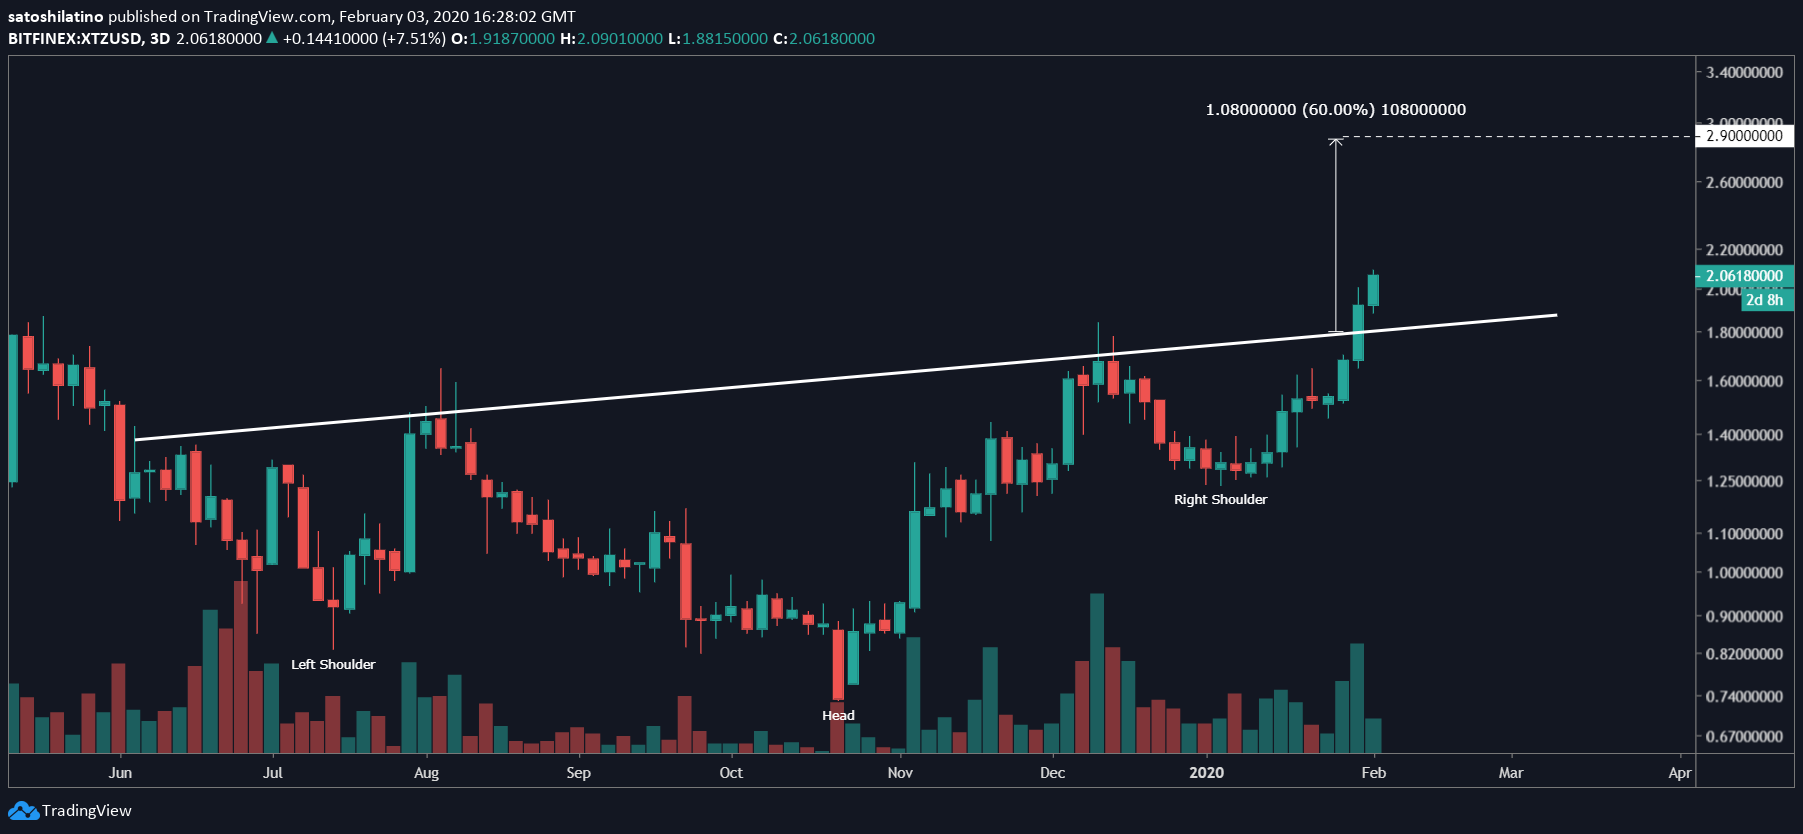
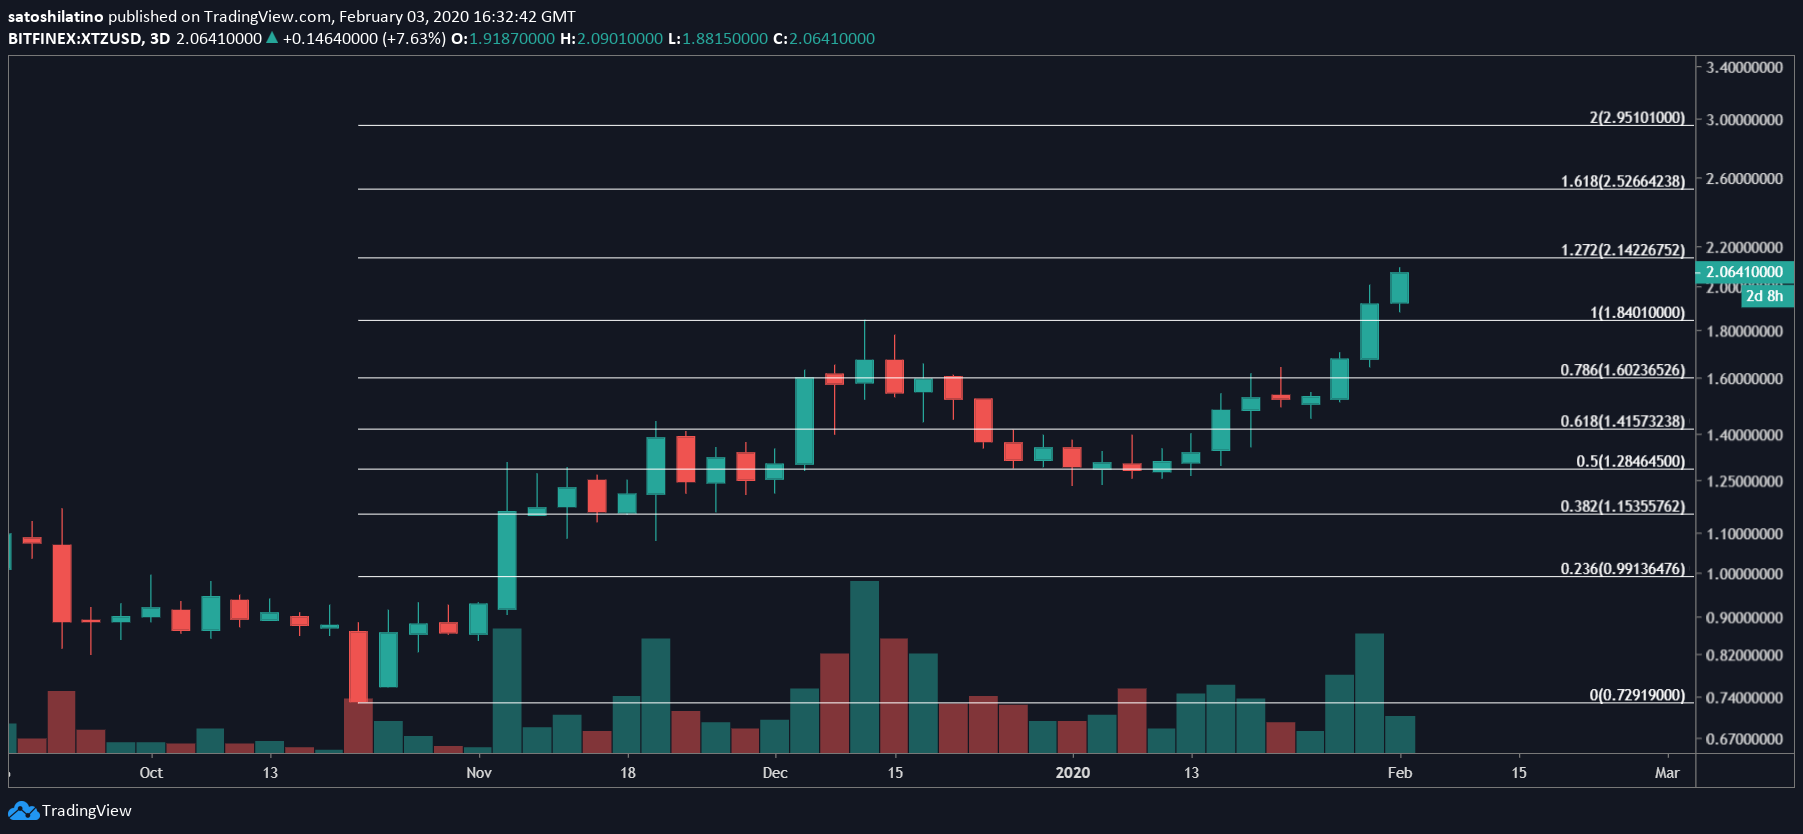
On its way up, Tezos could find resistance around the 127.2% and 161.8% Fibonacci retracement level. These hurdles sit $2.14 and $2.52, respectively.
Despite the bullish outlook, the TD sequential predicts that a retracement could soon be underway. This technical index is currently presenting a sell signal in the form of an aggressive 13. Additionally, another bearish signal could be given in the form of a green nine candlestick three days from now, on Feb. 6.
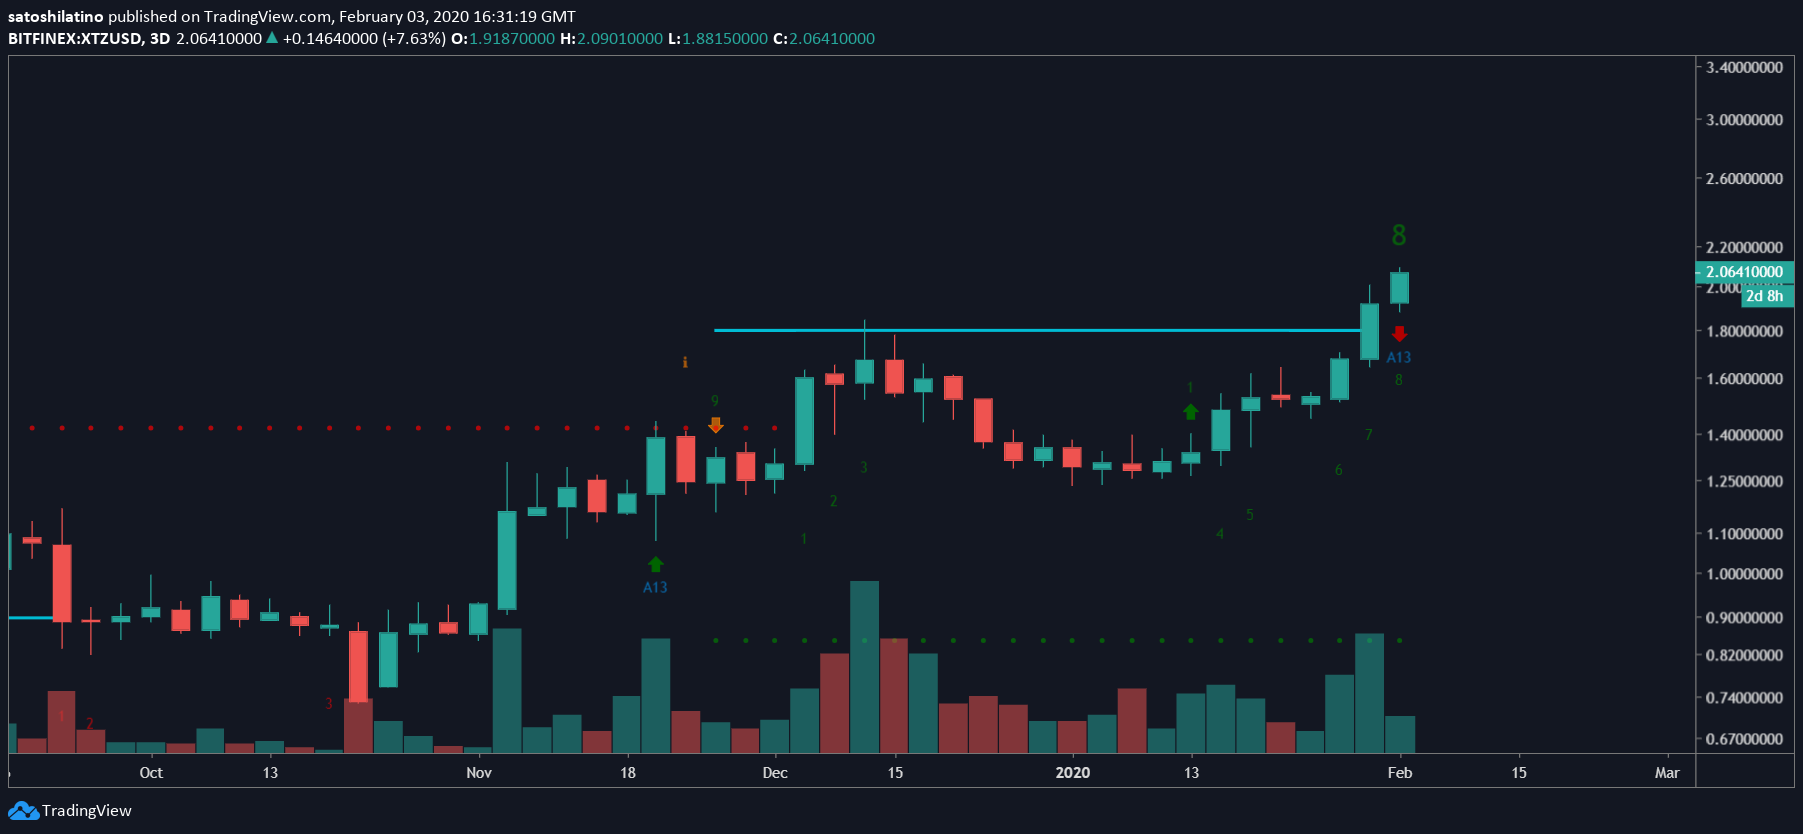
The bearish formation forecasts a one to four candlestick correction that could take XTZ down to test the $1.80 level for support. An increase in selling pressure that sends this coin below this level of support could trigger a steeper correction — to the 78.6% or the 61.8% Fibonacci retracement levels at $1.60 and $1.42.
Now, it’s a battle between whether XTZ will hit the target presented by the inverse head-and-shoulders pattern or if its price will first retrace from current levels.