
EOS, Tezos, Chainlink Show Signs of Exhaustion
Recent bullish sentiment pushes market from fear to greed. Exhaustion may follow.
EOS, Tezos, and Chainlink may reverse their trends as their momentum is exhausted.
EOS Prepares for a Pullback
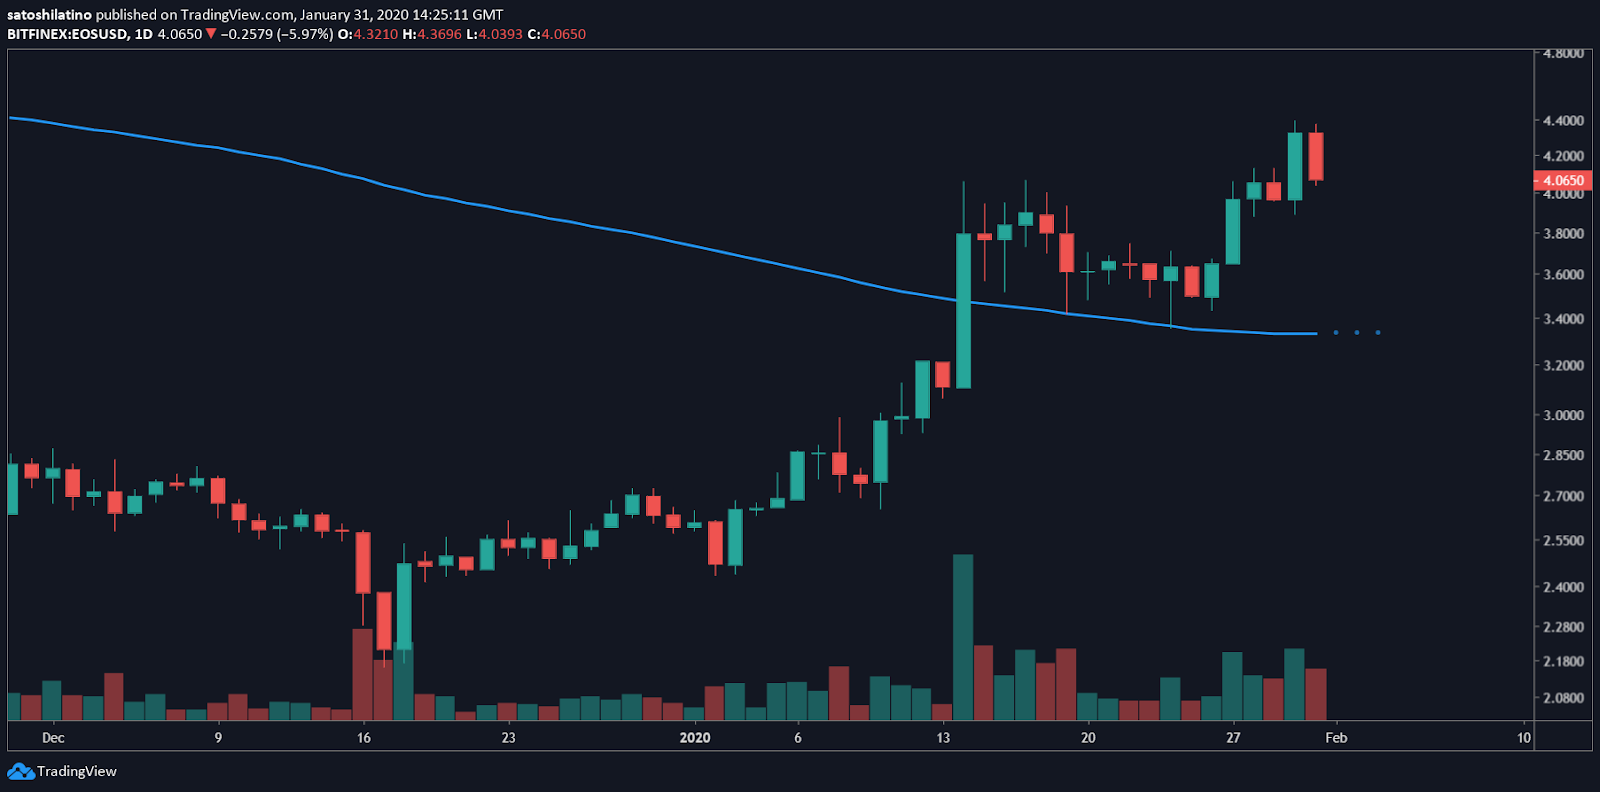
After reaching a market bottom of $2.16 on Dec. 17, 2019, EOS entered a bull rally that has seen its price double. The sudden increase in demand allowed this cryptocurrency to move above its 200-day moving average. Turning this level of resistance into support is usually seen by many traders as a further bullish indicator.
However, the recent high of $4.39 appears to have served as a take-profit point for many investors, triggering an 8.3% percent retracement.
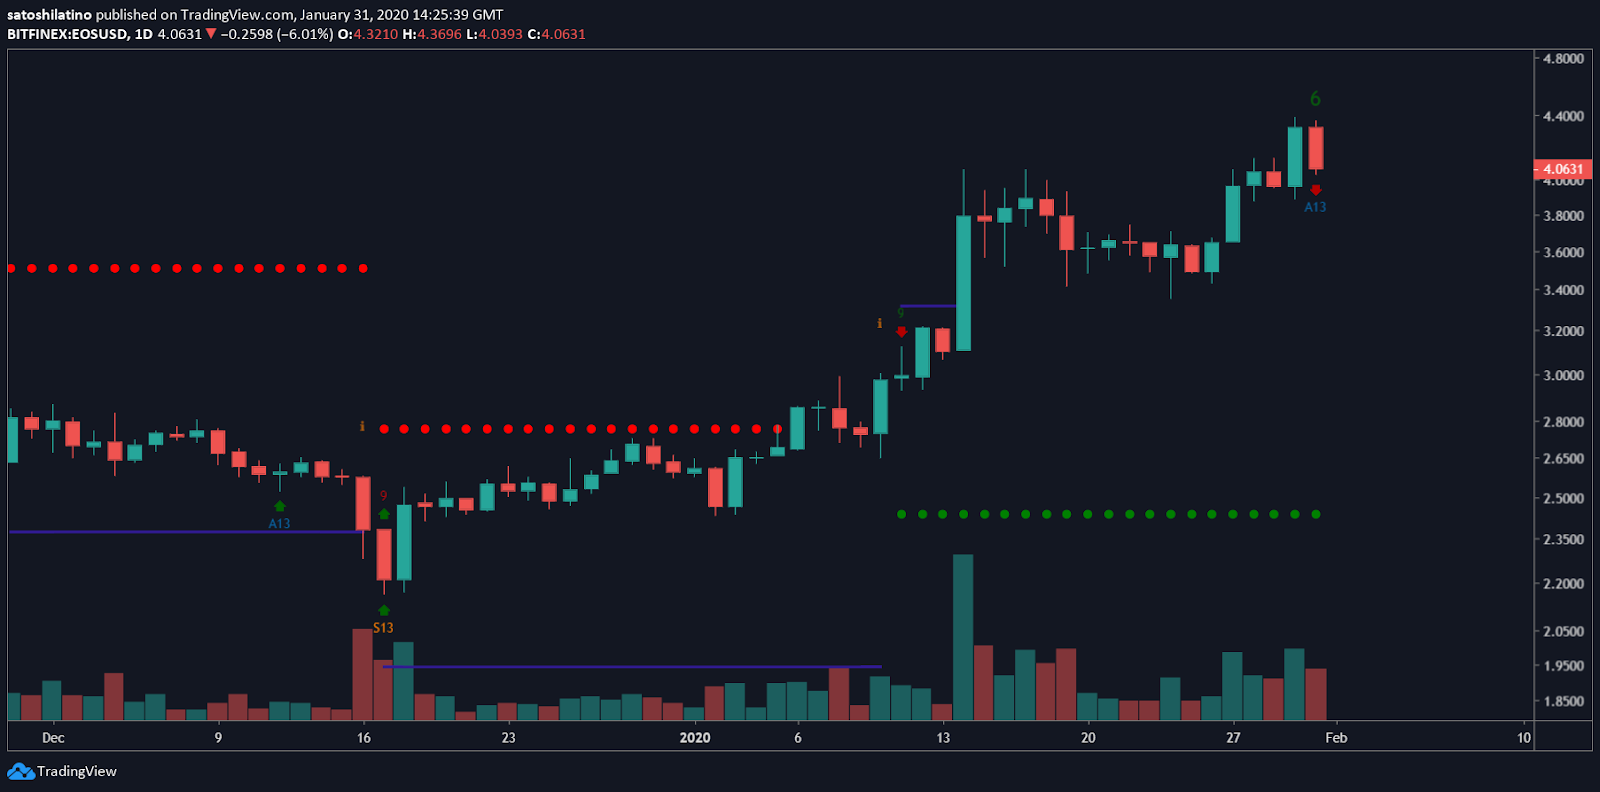
Based on the TD sequential indicator, this crypto could experience an even steeper decline. This technical index is currently presenting a sell signal in the form of an aggressive 13 on EOS’s 1-day chart. The bearish formation estimates a one to four candlesticks correction, but if the selling pressure is strong enough, a new downward countdown could begin.
A red two candlestick trading below a preceding red one candle can serve as confirmation of the sell signal.
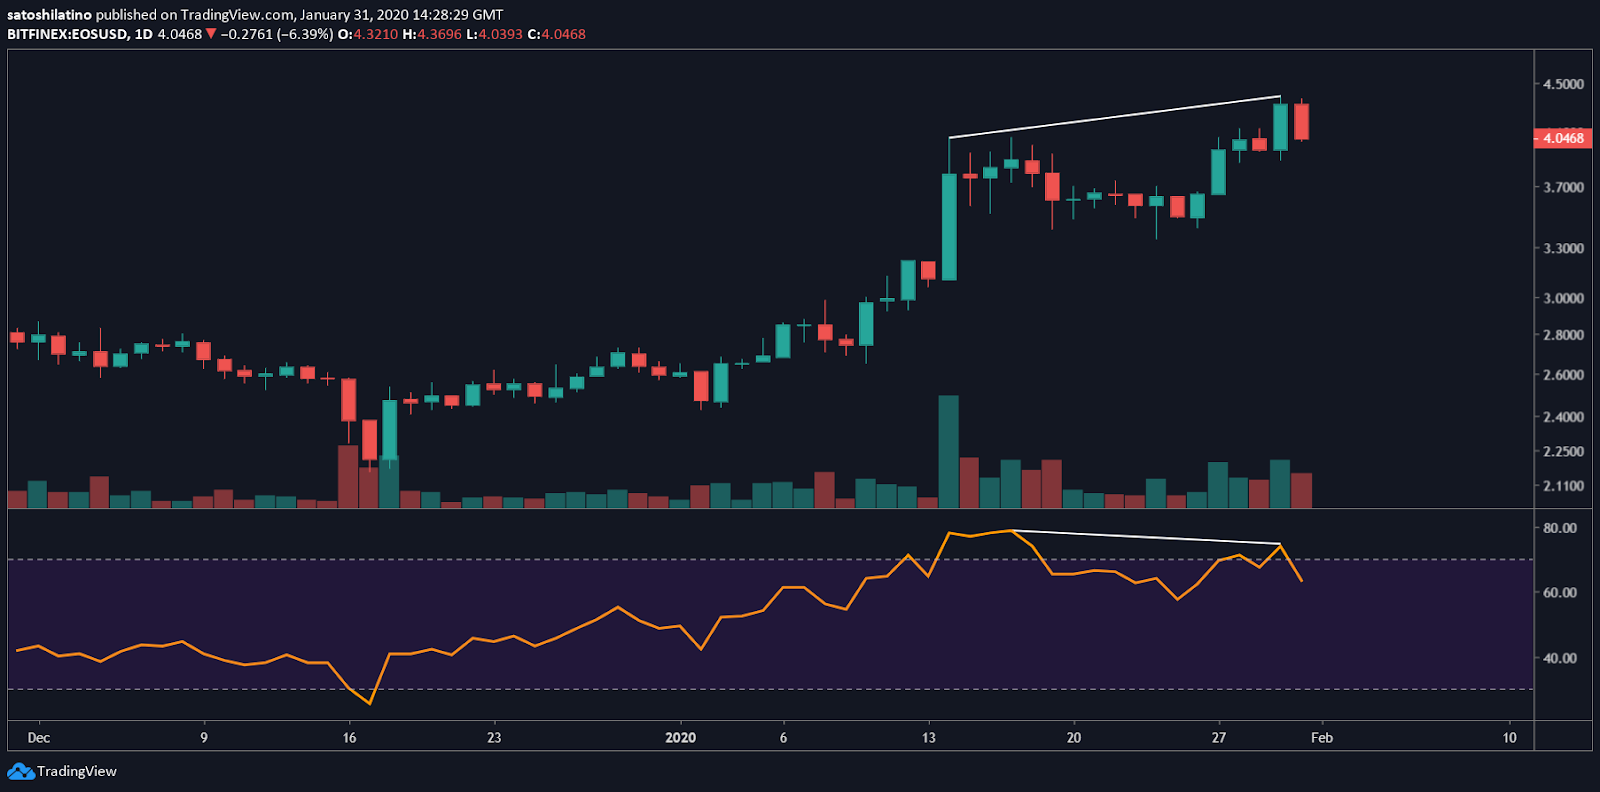
Adding credence to the bearish outlook, a bearish divergence between the price of EOS and the Relative Strength Index (RSI) is forming within the same time frame.
Divergences occur when the price of an asset is making a series of higher highs while the RSI is making lower lows. Although this technical pattern does not provide a precise selling point, it is a sign that the uptrend is reaching an exhaustion point.
An increase in the amount of sell orders behind EOS could allow it to test its 200-day moving average for support. This level of support is hovering around $3.33, which is also where the 50% Fibonacci retracement level sits. Closing below the 78.6% Fibonacci retracement level at $3.92 would increase the odds for such a downward move.
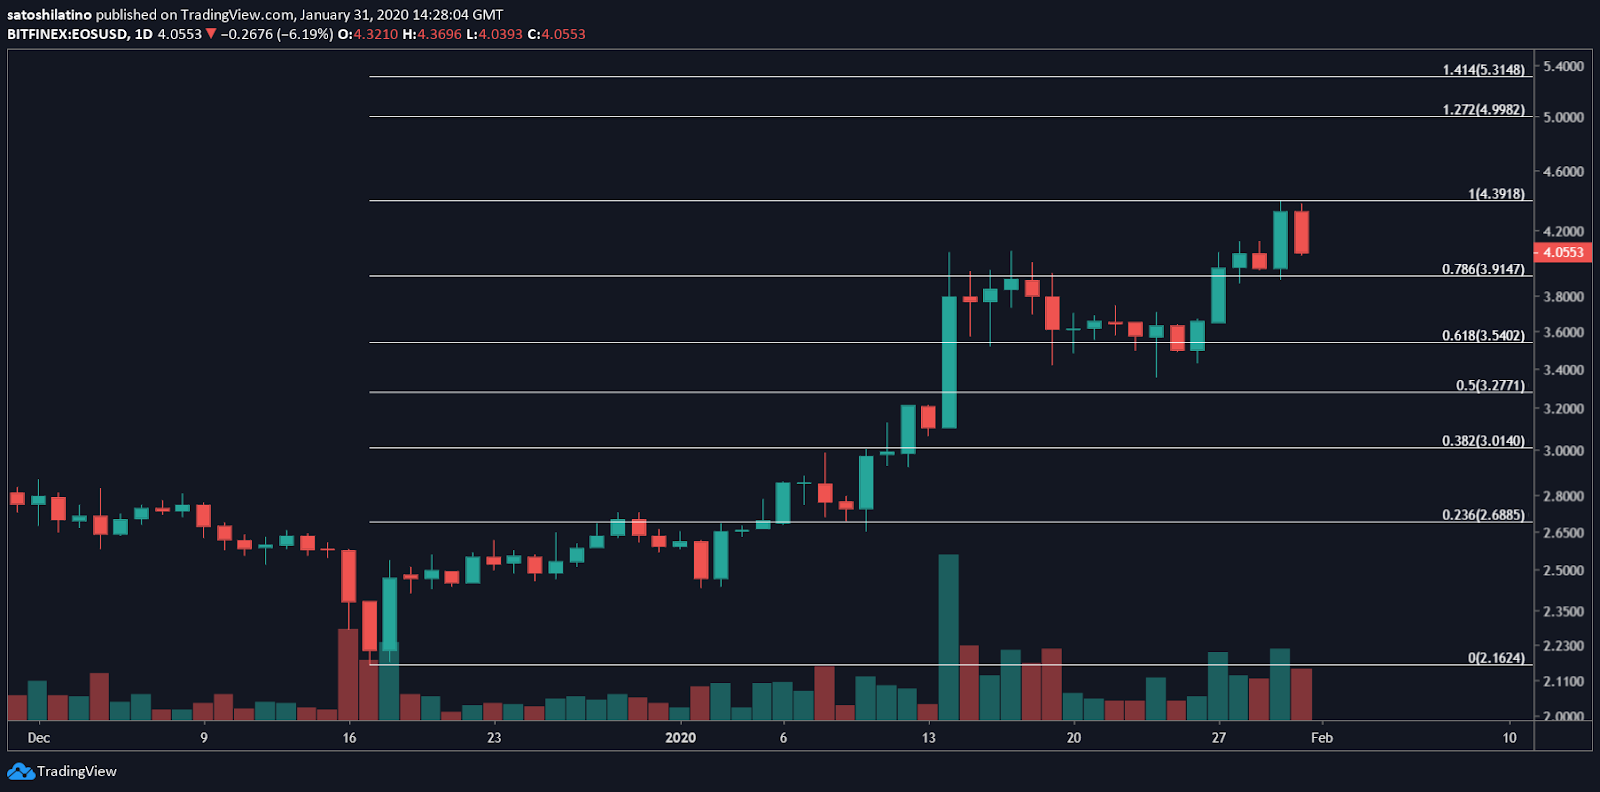
Nevertheless, a spike in volume around the current price level could invalidate the bearish signals. If EOS is able to close above the recent high of $4.39, investors would likely enter a FOMO (fear-of-missing-out) stage, pushing the price of this cryptocurrency to new highs. The next significant levels of resistance sit at $5 and $5.32.
Tezos Approaches a Pivotal Point
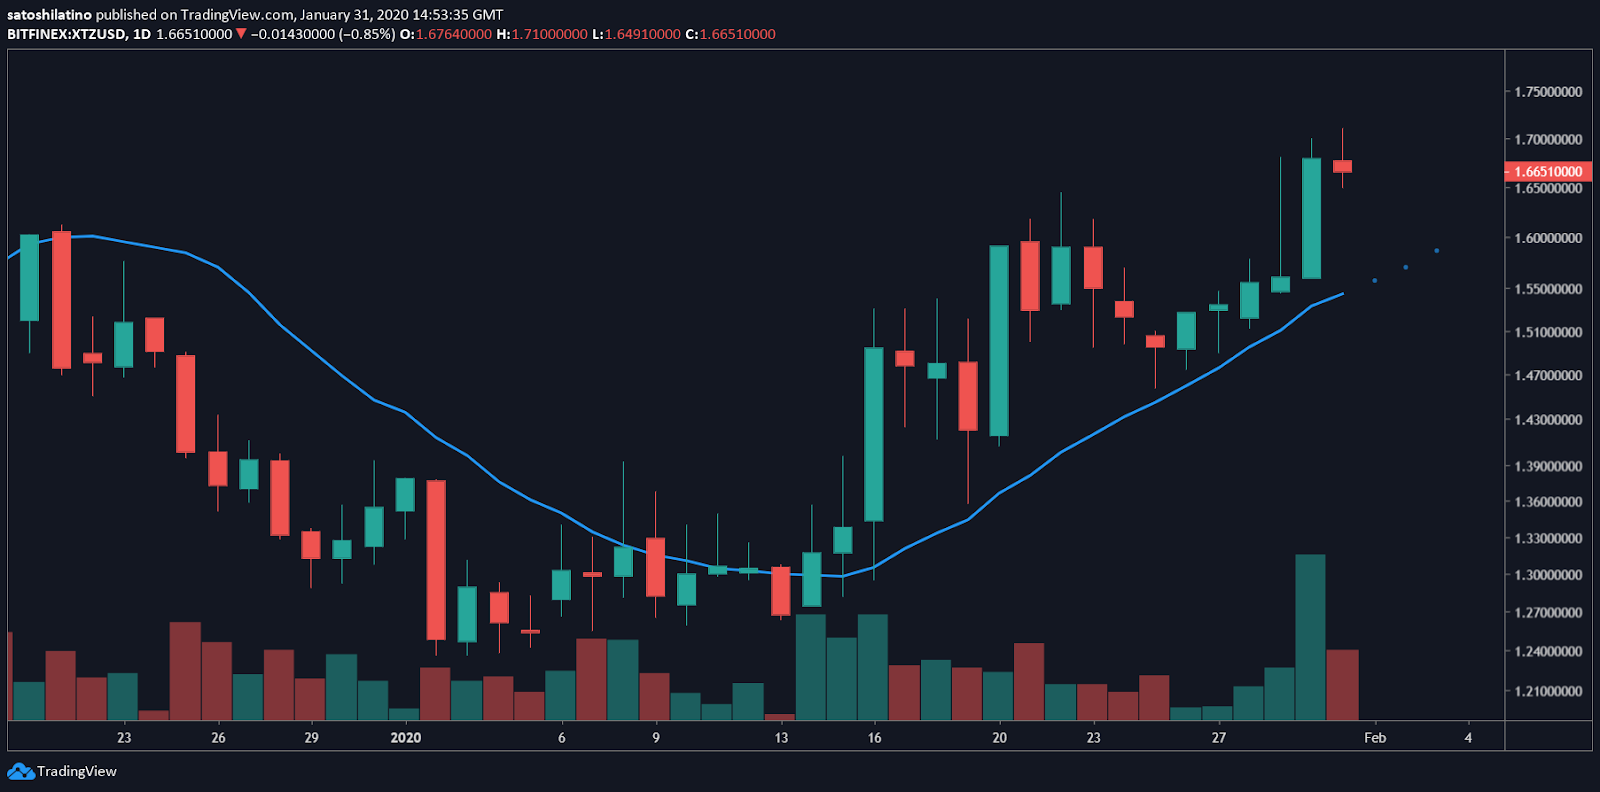
Tezos’ 15-day moving average appears to have predictive price powers. Every time XTZ moves below this moving average, it enters a bearish trend. Conversely, when this cryptocurrency breaks above this significant barrier, a new uptrend begins.
As a matter of fact, Tezos is up 34% since it closed above its 15-day moving average on Jan. 14. Since then, this lagging indicator is serving as support preventing XTZ from a sudden drop.
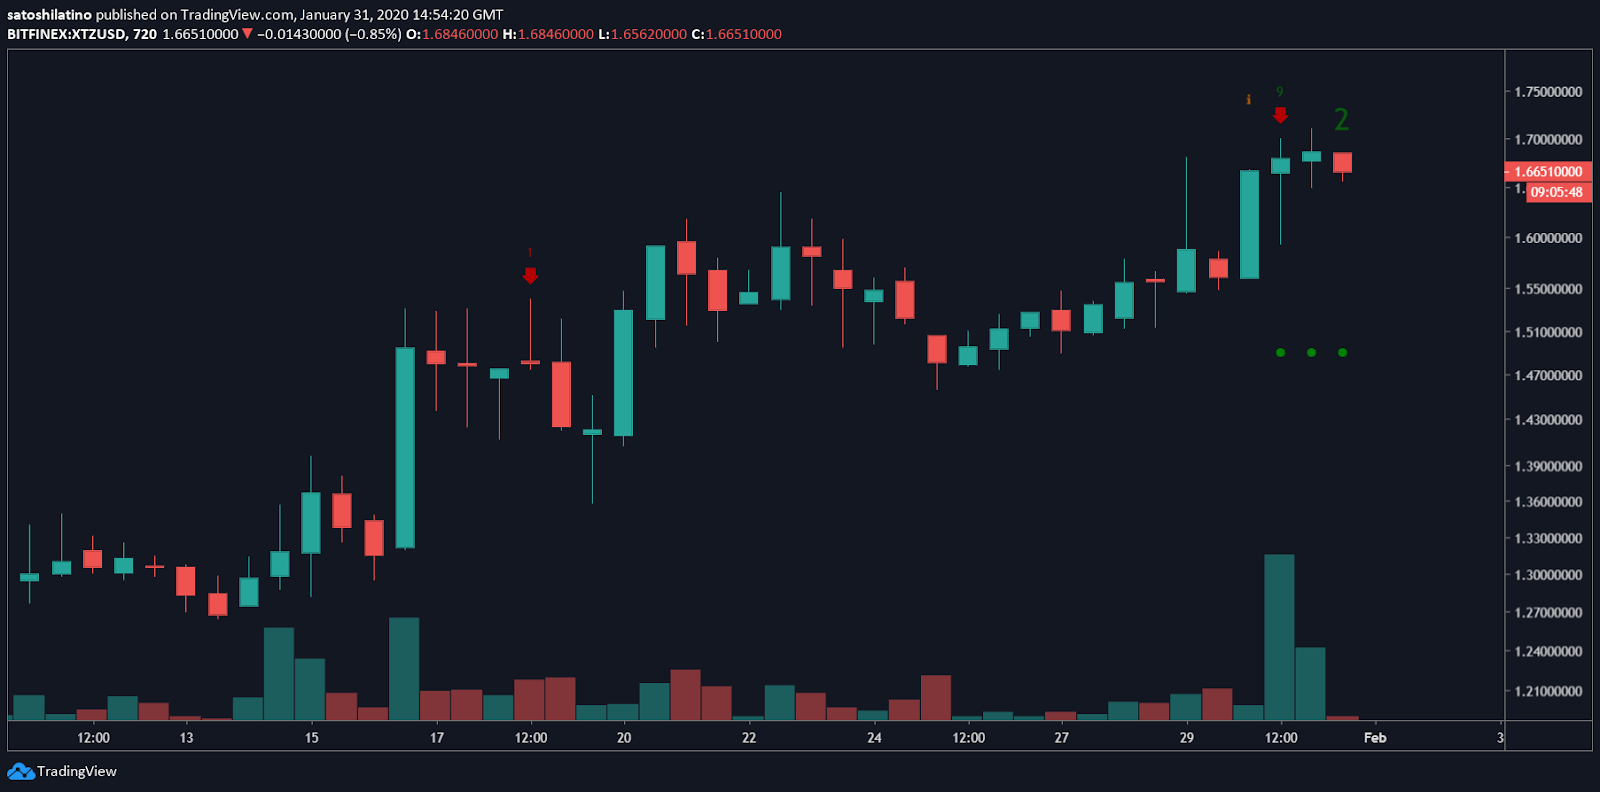
Now, the TD sequential indicator presented a sell signal on XTZ’s 12-hour chart. If validated, this crypto could take a nosedive to test the support formed by 15-day moving average. This bearish formation was given in the form of a green nine candlestick, estimating a one to four candlestick correction before the continuation of the bullish trend.
A bearish impulse could take Tezos down to the 78.6% Fibonacci retracement level. Breaking below this price hurdle could ignite an increase in the selling pressure behind this cryptocurrency, pushing it to the next level of support around the 61.8% Fibonacci retracement level at $1.53. This price level is also where the 15-day moving average sits.
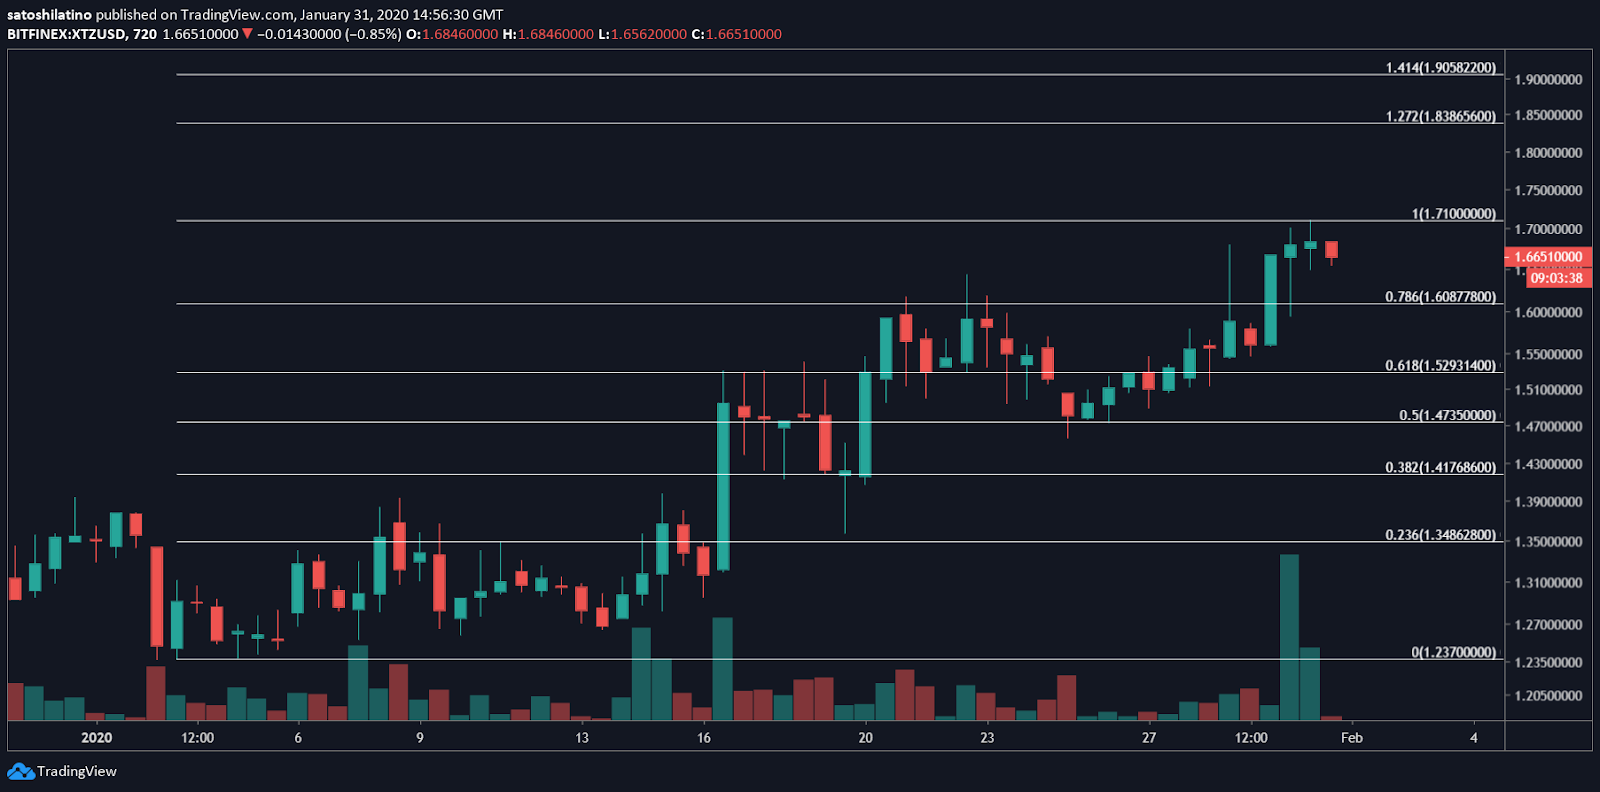
Due to the high spikes in volume on XTZ’s 12-hour chart, the bullish outlook cannot be ignored Therefore, if Tezos is able to close decisively above $1.71, it would likely climb up to test the $1.84 resistance level.
It is worth noting that this level of resistance has been able to hold the price of XTZ from a further advance since September 2018. Thus, breaking above it could set the stage for a parabolic upward movement.
Chainlink Fights Strong Resistance
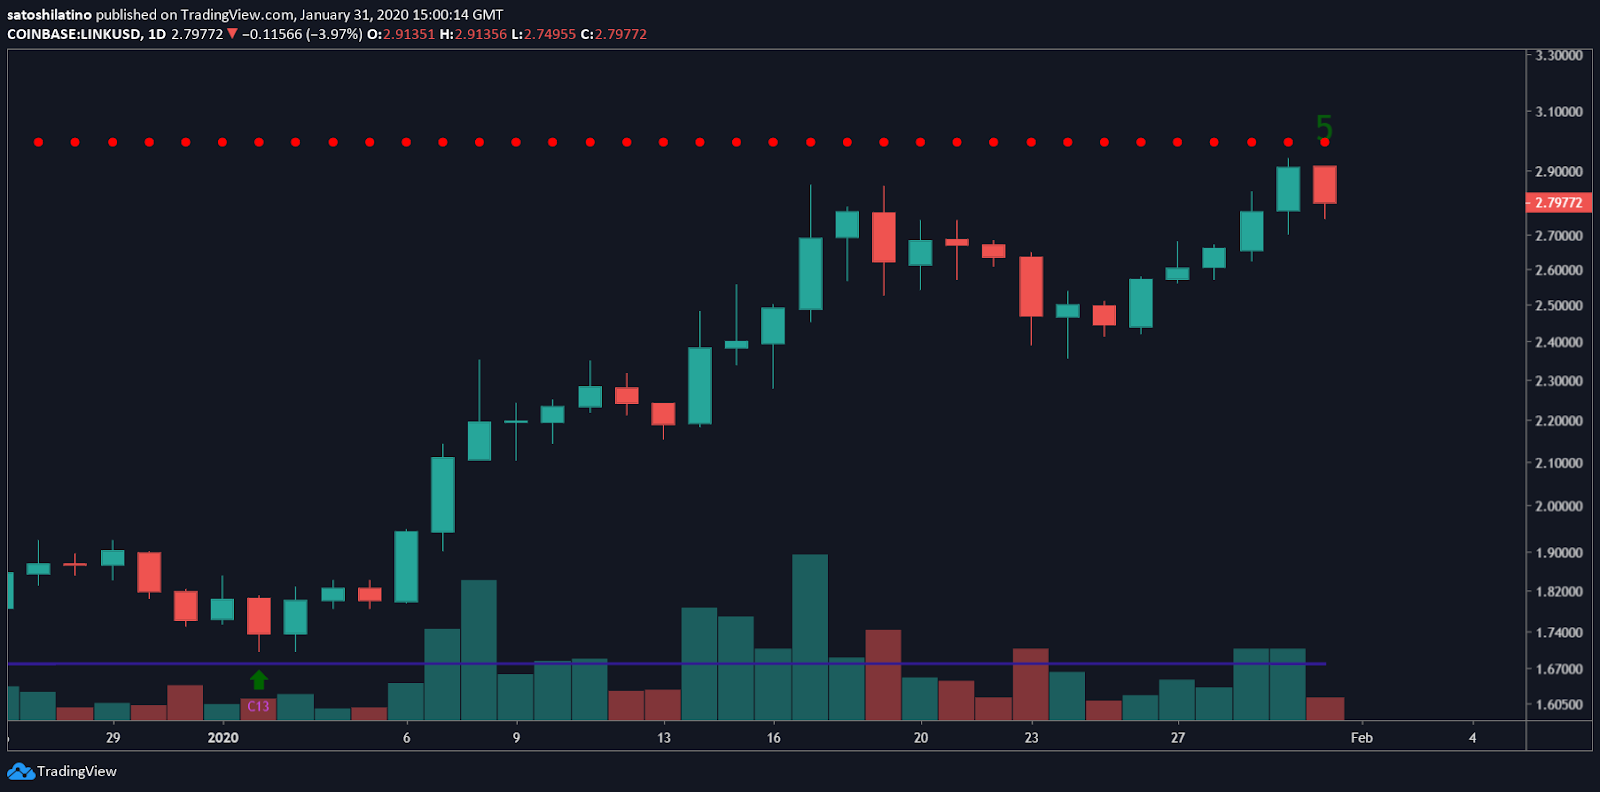
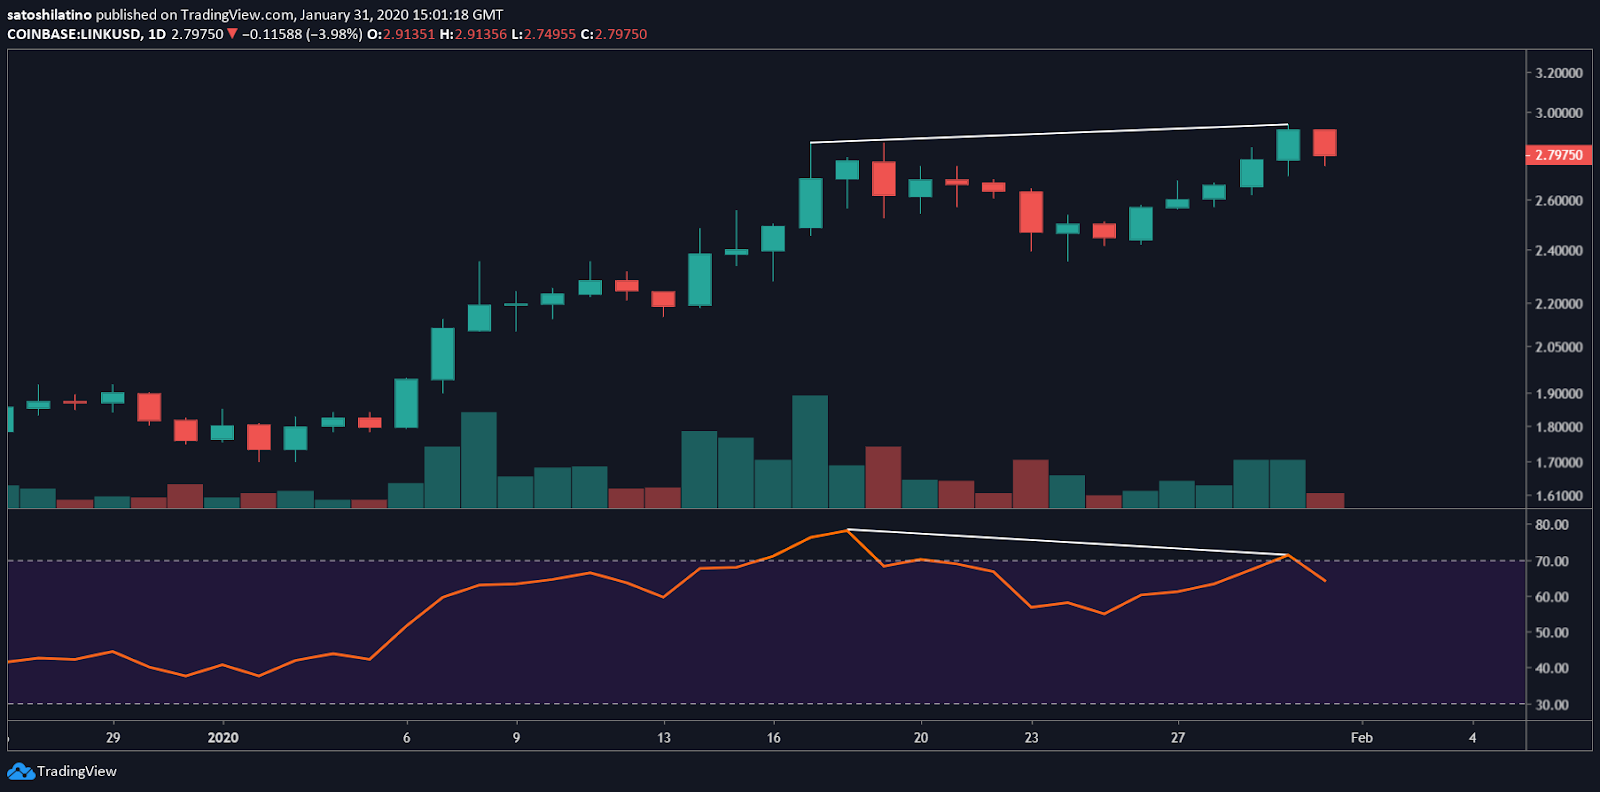
Like EOS, Chainlink entered a bull trend after reaching a market bottom of $1.63 on Dec. 18, 2019. Since then, LINK surged nearly 80% to hit a high of $2.94 on Jan. 30.
Based on the TD sequential indicator, the bullish impulse took this cryptocurrency up to test the setup trendline, which is currently serving as an important resistance barrier on the 1-day chart. If this hurdle continues to hold, Chainlink would likely retrace before it tries to break through it again.
The bearish divergence that is forming between the price of Chainlink and the Relative Strength Index supports the idea of a pull back. Even though this technical pattern cannot be considered definite proof that a correction is underway, it serves as an indication that the uptrend is reaching an exhaustion point.
If Chainlink indeed retraces, it could try to test the 23.6% or 38.2% Fibonacci retracement level. These levels of support sit at $2.63 and $2.44, respectively.
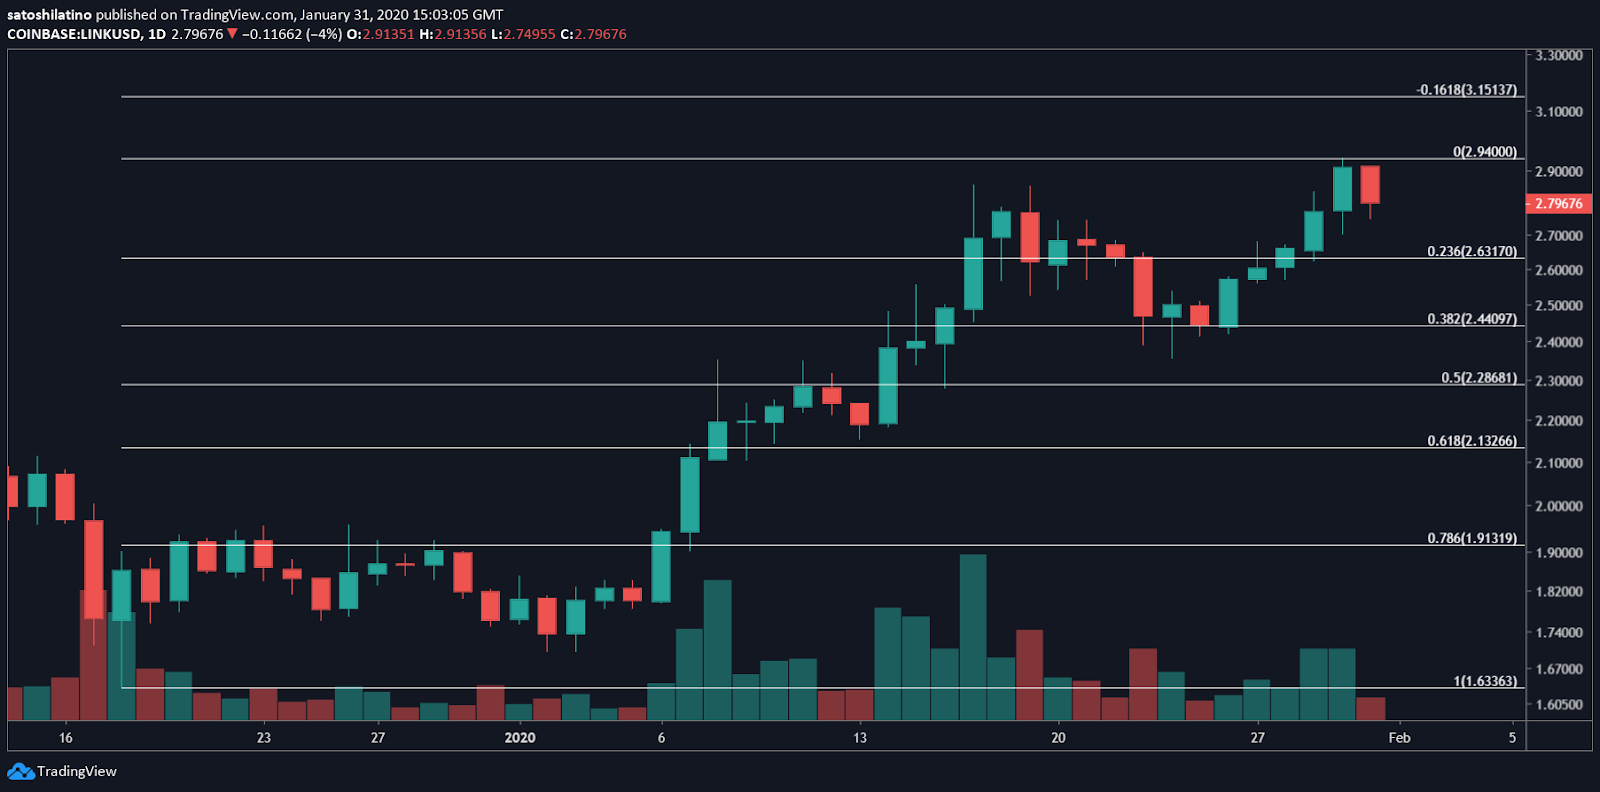
Nonetheless, moving past the setup trendline and the recent high of $2.94 could trigger an increase in demand for LINK. The bullish momentum would likely take it to reach a higher high of $3.15.
Overall Market Sentiment
Since Jan. 3, over $80 billion were injected into the cryptocurrency market. The substantial inflow of capital allowed most cryptos in the market to post significant gains. Among them are EOS, Tezos and Chainlink, which have seen their price increase by 80%, 37%, and 73% since then.
The bullish sentiment in the market, however, pushed the Crypto Fear and Greed Index into “greed.” Usually, when sentiment becomes too exuberant then a retracement becomes more likely. It’s a matter of time before the a correction takes place.