 Earn with Nexo

Tezos Price Analysis XTZ / USD: Avoiding The Greecey Pole
Tezos' bullish momentum is strong enough for a $2 push.
- Tezos has a bullish short-term bias, with the XTZ / USD pair trading close to the best levels of the year so far
- The four-hour time frame shows that buyers have invalidated a large head and shoulders pattern
- The daily time frame shows that the large inverted head and shoulders pattern has now been triggered
Tezos / USD Short-term price analysis
Tezos has a bullish short-term outlook, with the XTZ / USD pair still trading close to the best levels of the year so far.
The four-hour time frame is showing that buyers have negated a bearish head and shoulders pattern, with the XTZ / USD pair yet to reach its bullish invalidation target.
Technical indicators are rising on the four-hour time frame and are now starting to appear extremely overstretched.
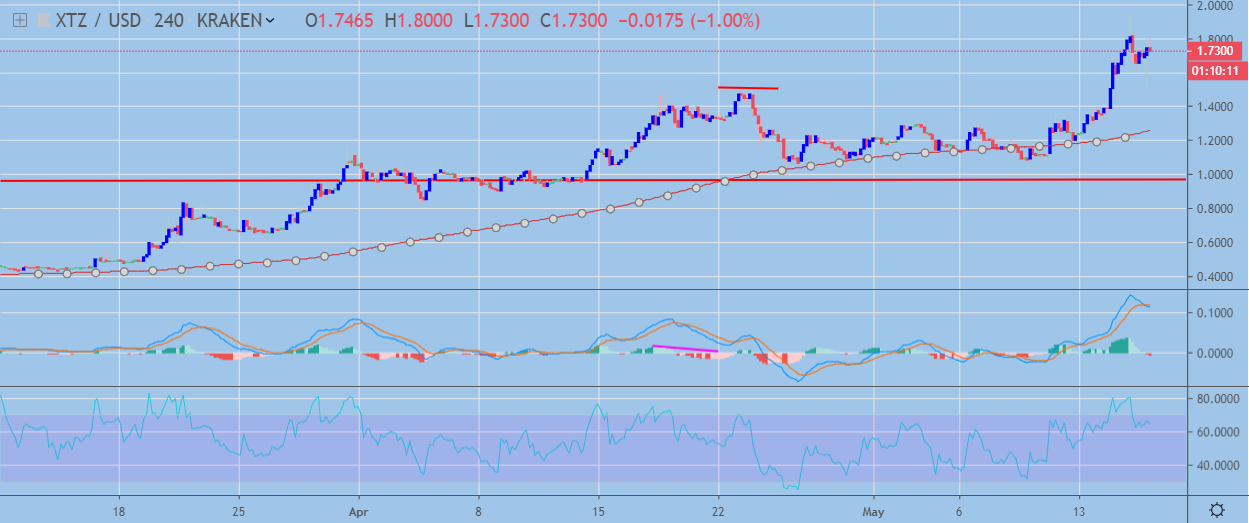 XTZ / USD H4 Chart by TradingView
Pattern Watch
Traders should note that the 2.0000 level is the bullish target on the four-hour time frame now that head and shoulders pattern has been invalidated.
Relative Strength Index
The RSI indicator remains bullish on the four-hour time frame, although it is now starting to turn lower.
MACD Indicator
The MACD indicator is turning bearish on the four-hour time frame and shows considerable scope for further downside.
Fundamental Analysis
Although the overall market is experiencing a downside correction today, Tezos is outperforming most of the top-20 cryptocurrencies.
This is likely happening due to the the vote on the promotion of the Athens A proposal to mainnet, which has almost reached the approval threshold.
Athens A will make it easier to deploy smart contracts on the network, and will decrease the proof of stake roll size to 8,000 XTZ, which may well increase the demand for cryptocurrency.
Tezos / USD Medium-term price analysis
Tezos has a bullish medium-term trading outlook, with the XTZ / USD pair performing a major technical breakout on the daily time frame.
The daily time frame is showing that an inverted head and shoulders pattern has been triggered, with the bullish pattern yet to reach its overall upside objective.
Technical indicators across the daily time frame are bullish and continue to issue strong buy signals.
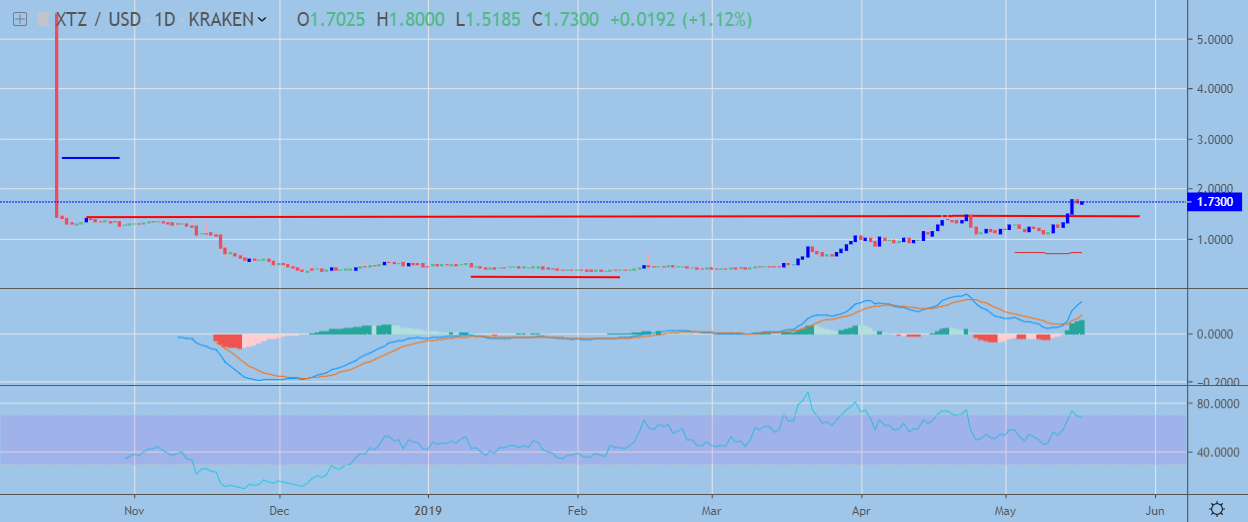 XTZ / USD Daily Chart by TradingView
Pattern Watch
Traders should note that the 2.6000 level is the upside target of the bullish inverted head and shoulders pattern on the daily time frame.
Relative Strength Index
The Relative Strength Index is bullish on the daily time frame, although it is trading close to overbought conditions.
MACD Indicator
The MACD indicator on the daily time frame is bullish and continues to issue a buy signal.
Fundamental Analysis
Although the Tezos ecosystem still remains small compared to its competitors, the project attracts investors by providing high yields in comparison to other staking cryptocurrencies. This could potentially help the project grow its value in the medium term.
Conclusion
Tezos continues to outperform, with the ever-advancing cryptocurrency performing another major bullish breakout across both time frames.
The bullish pattern on the daily time frame points to a stronger bullish move above the 2.0000 level over the medium-term horizon.
Check out our coin guide to understand what Tezos is baking.