 Earn with Nexo

Tezos Price Analysis XTZ / USD: Uncertain Gains
But it fell too hard to appreciate them.
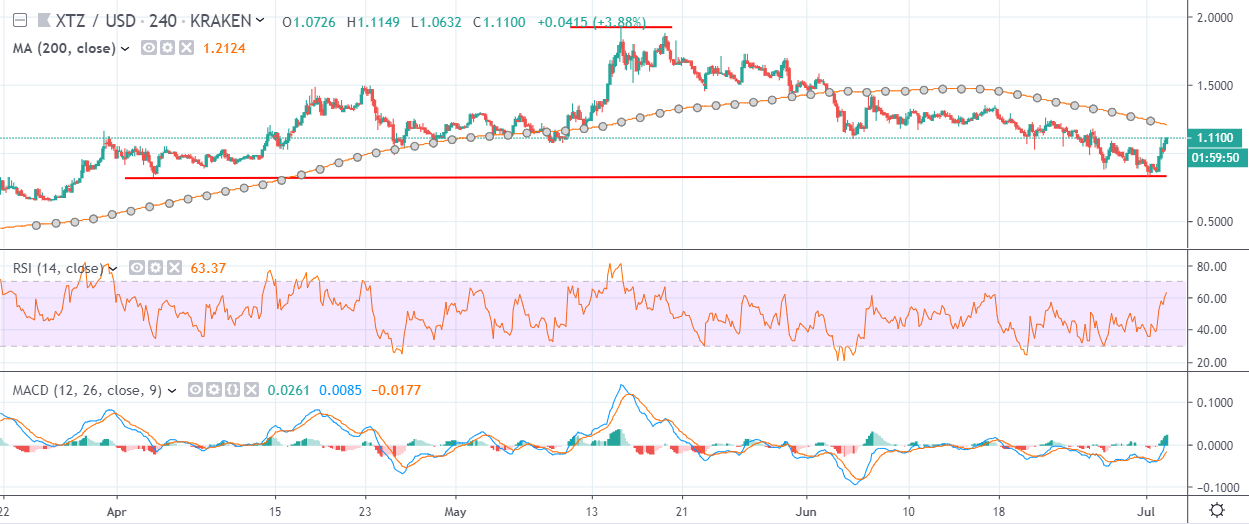
- Tezos has a bearish short-term bias, with the XTZ / USD pair still trading under its 200-period moving average on the four-hour time frame
- The four-hour time frame continues to show a large head and shoulders pattern
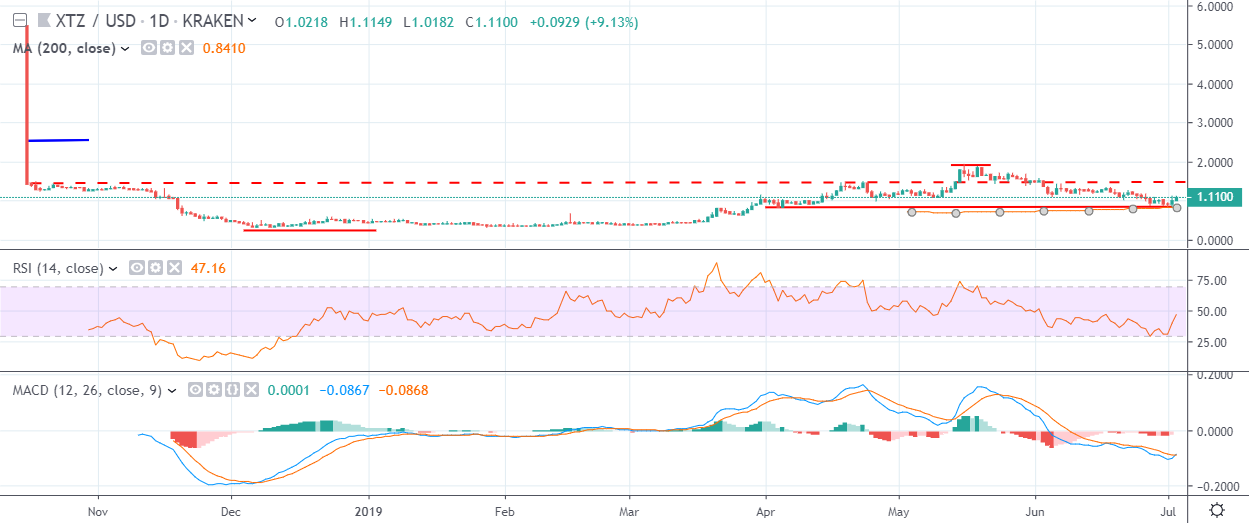
- The daily time frame is conflicted with both valid bullish and bearish patterns forming
Tezos / USD Short-term price analysis
Tezos has a bearish short-term bias, with the XTZ / USD pair continuing to trade below its key 200-period moving average on the four-hour time frame.
The four-hour time frame shows that a large bearish pattern has formed, with the XTZ / USD pair rebounding sharply from the neckline of the head and shoulders pattern.
Technical indicators are bullish on the four-hour time frame and are starting to generate a strong buy signal.
Pattern Watch
Traders should note that a complex head and shoulders pattern is forming across the four-hour time frame.
Relative Strength Index
The RSI indicator remains bullish on the four-hour time frame and shows scope for further upside.
MACD Indicator
The MACD indicator is bullish on the four-hour time frame and is generating a strong buy signal.
Tezos / USD Medium-term price analysis
Tezos has a bullish medium-term trading outlook, with XTZ / USD bulls still holding the cryptocurrency above major support on the daily time frame.
The daily time frame is showing that both bullish and bearish patterns are now visible, highlighting the that medium-term prospects for the XTZ / USD pair are currently unclear.
Technical indicators across the daily time frame remain bearish, although they are attempting to correct higher.
Pattern Watch
Traders should exercise caution as the daily time frame is extremely uncertain.
Relative Strength Index
The Relative Strength Index is also attempting to recover higher on the daily time frame, although it still remains bearish.
MACD Indicator
The MACD indicator on the daily time frame is attempting to trade higher, although it still remains technically bearish.
Conclusion
The recent double-digit advance in Tezos has failed to secure the XTZ / USD pair’s short-term outlook, with the bearish pattern on the four-hour time still looming over the cryptocurrency.
The medium-term outlook for the XTZ / USD pair is currently unclear, with opposing patterns on the daily time frame adding to the confusion.
Check out what Tezos is baking in our coin guide.