
TRON Price Analysis TRX / USD: Crescendo Of Tweets
TRON is surging after Justin Sun made yet another hopeful tweet about some future revelations.
- TRON has a bullish short-term outlook, with the cryptocurrency testing towards the current 2019 trading high
- A bullish inverted head and shoulders pattern has now been triggered on the four-hour time frame
- The daily time frame shows that the TRX / USD pair can trade much higher over the medium-term
TRON / USD Short-term price analysis
TRON has a bullish short-term trading outlook, with the cryptocurrency testing towards the best level of the year so far.
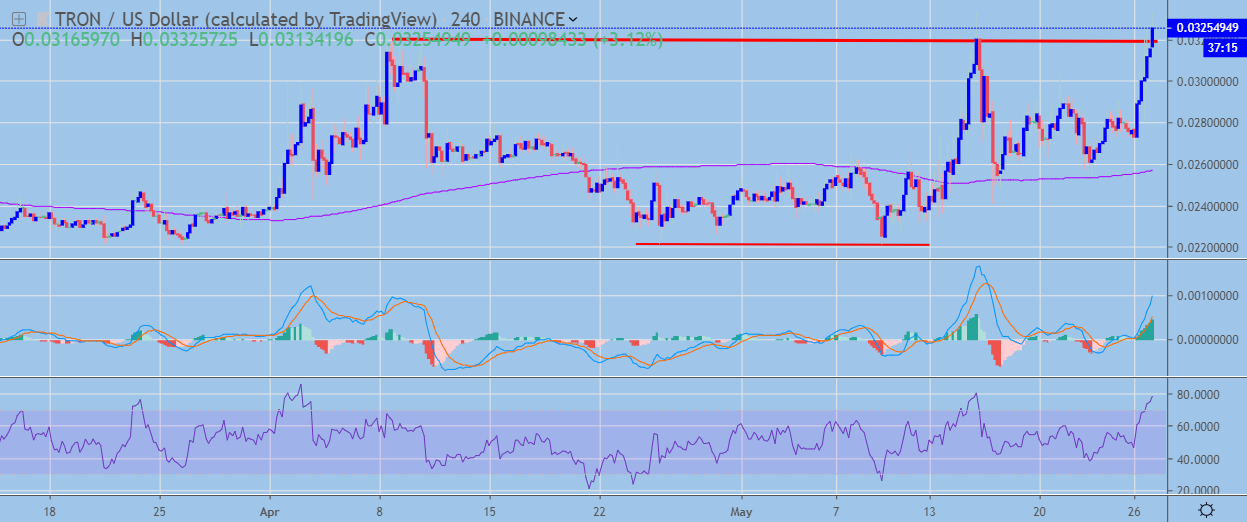
The four-hour time frame continues to show a large inverted head and shoulders pattern, with TRX / USD buyers triggering the bullish pattern into action.
Technical indicators on the four-hour time frame are bullish and continue to point to further near-term gains in the TRX / USD pair.
 TRX / USD H4 Chart by Trading View
Pattern Watch
Traders should note that the July 18th, 2018 swing-high is the initial upside target of the bullish pattern on the four-hour time frame.
Relative Strength Index
The Relative Strength indicator has turned bullish on the four-hour time frame and shows scope for further upside.
MACD Indicator
The MACD indicator has turned bullish on the four-hour time frame and continues to generate a strong buy signal.
Fundamental Analysis
Tron has surged after its CEO Justin Sun issued a tweet stating “something amazing is going about TRON”. Sun has made several tweets of a similar nature during this month, successfully raising speculative interest in the coin.
TRON / USD Medium-term price analysis
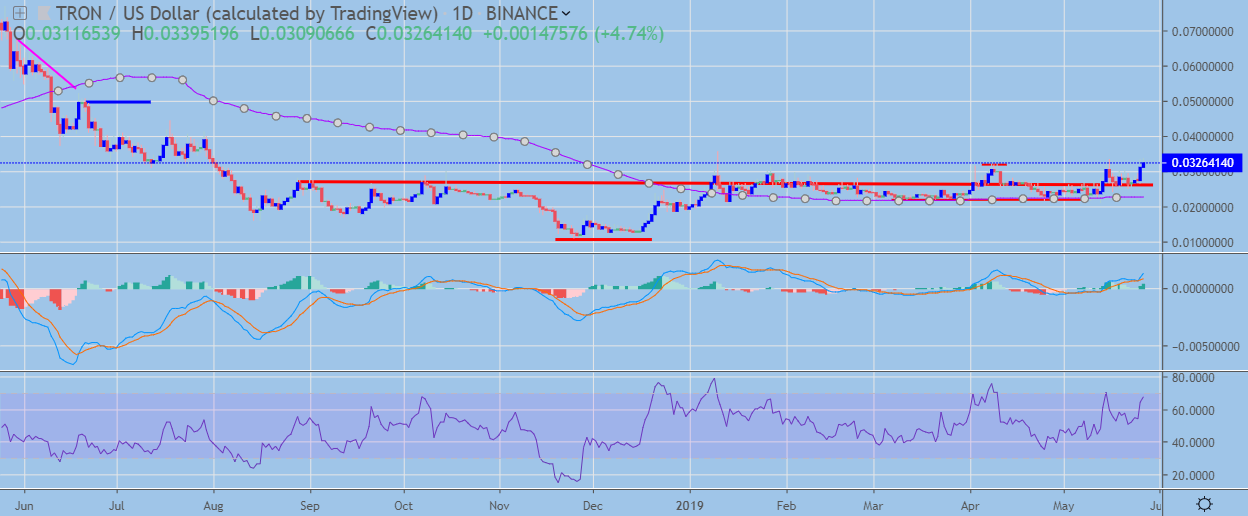
TRON has a bullish medium-term outlook, with the TRX / USD pair continuing to enjoy robust medium-term buying demand.
The daily time frame is showing that the TRX / USD pair is trading above the neckline of a large inverted head and shoulders pattern, which has been in place all year.
Technical indicators on the daily time frame are bullish and are pointing to further upside in the cryptocurrency.
 TRX / USD Daily Chart by Trading View
Pattern Watch
Traders should note that a strong technical breakout in the TRX / USD pair may occur if the current 2019 trading high is breached.
Relative Strength Index
The RSI indicator is still bullish on the daily time frame, although it is now approaching overbought territory.
MACD Indicator
The MACD indicator on the daily time frame has turned bullish and still shows sizeable amounts of bullish MACD price divergence.
Fundamental Analysis
In the medium term, TRON looks speculative. Its founder has been raising interest in the project using Twitter, but the “amazing accomplishments” that were hinted at during this month have not yet been revealed to the public, making it hard to predict their actual effect on the project.
Conclusion
TRON has staged a strong upside recovery, with the four-hour time frame now showing that a bullish technical breakout is underway.
The bullish pattern on the daily frame may reach its full upside projection if buyers can move the TRX / USD pair to a new 2019 trading high and trigger the next round of technical buying.
To see what the project is all about beyond the tweets, check out coin guide.