 Earn with Nexo

July 17
TRON Price Analysis TRX / USD: A Passing Storm
Bullish medium-term indicates a future recovery for TRON.
- TRON has a bearish short-term bias, with the cryptocurrency trading at its lowest level since March 4th, 2019
- The four-hour time frame shows that the TRX / USD pair is now making lower lows and lower highs
- The daily time frame still shows a large bullish pattern and positive MACD price divergence
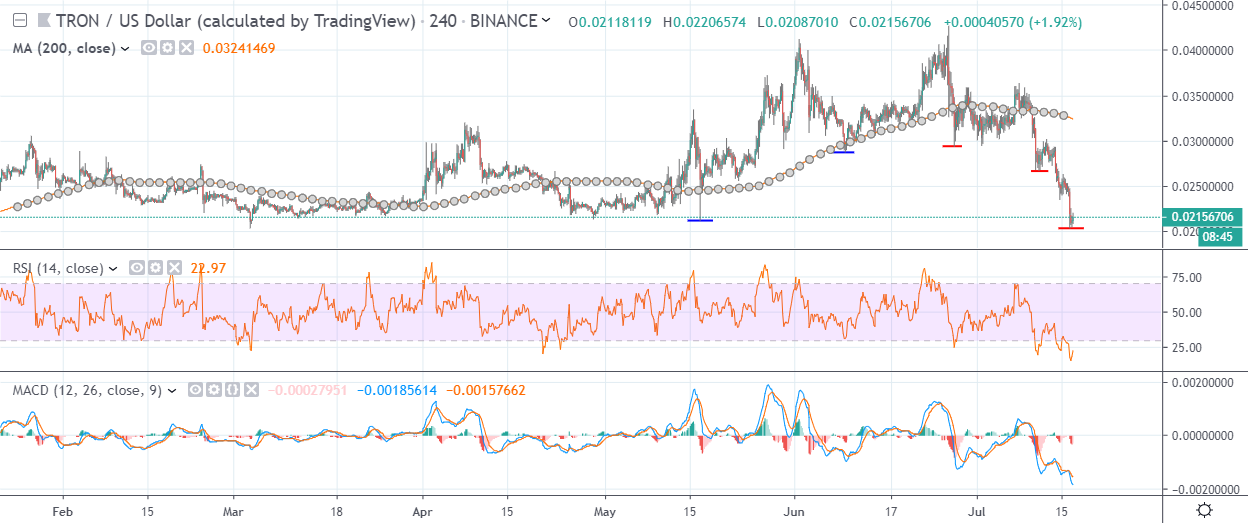
TRON / USD Short-term price analysis
TRON has a bearish short-term trading bias, with the cryptocurrency trading well below its 200-period moving average on the four-hour time frame.
The four-time frame is showing that a major technical shift is underway, with the TRX / USD pair breaking key support and continuing to make bearish lower lows and lower highs.
Technical indicators on the four-hour time frame are bearish, although they are now extremely oversold.
Pattern Watch
Traders should note that a bullish inverted head and shoulders pattern has now been invalidated on the daily time frame.
Relative Strength Index
The Relative Strength Index is bearish on the four-hour time frame, although it has now reached oversold territory.
MACD Indicator
The MACD indicator remains bearish on the four-hour time frame and continues to issue a sell signal.
TRON / USD Medium-term price analysis
TRON has a bearish medium-term outlook, with the cryptocurrency performing multiple-daily price closes below its 200-day moving average for the first time this year.
The daily time frame continues to show a valid inverted head and shoulders pattern and the presence of positive MACD price divergence, which extends back to June 2018.
Technical indicators on the daily time frame are bearish and continue to generate strong sell signals.
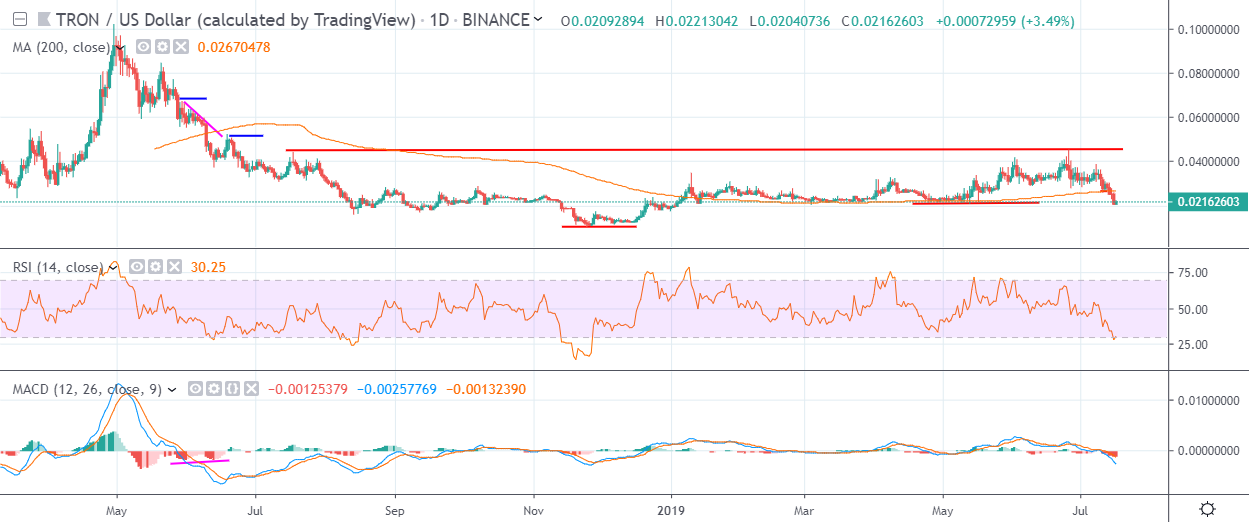
Pattern Watch
Traders should note that the recent drop in the TRX / USD pair may help to form a right-hand shoulder to complete the inverted head and shoulders pattern.
Relative Strength Index
The RSI indicator has turned bearish on the daily time frame and has reached its most oversold level of the year so far.
MACD Indicator
The MACD indicator on the daily time frame is currently extremely bearish and is issuing a strong sell signal.
Conclusion
TRON is undergoing a major technical shift in the short-term, with the TRX / USD pair posting bearish lower lows and lower highs and eroding a large portion of its second quarter gains.
The bullish pattern on the daily time frame remains valid alongside the positive MACD price divergence, which strongly suggests that the recent bearish storm may only be temporary.
Check out TRON in our coin guide.