 Earn with Nexo

VeChain Price Analysis VET / USD: Reemerging
VET is growing both in value and popularity.
- VeChain has a bullish short-term and medium-term trading outlook
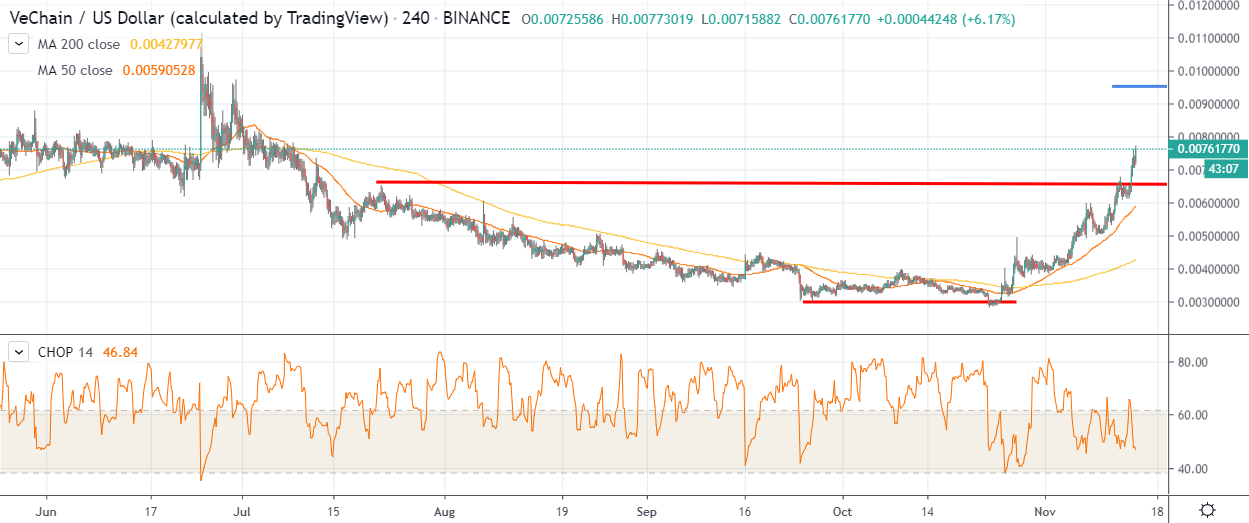
- The four-hour time frame shows that an inverted head and shoulders pattern has been triggered
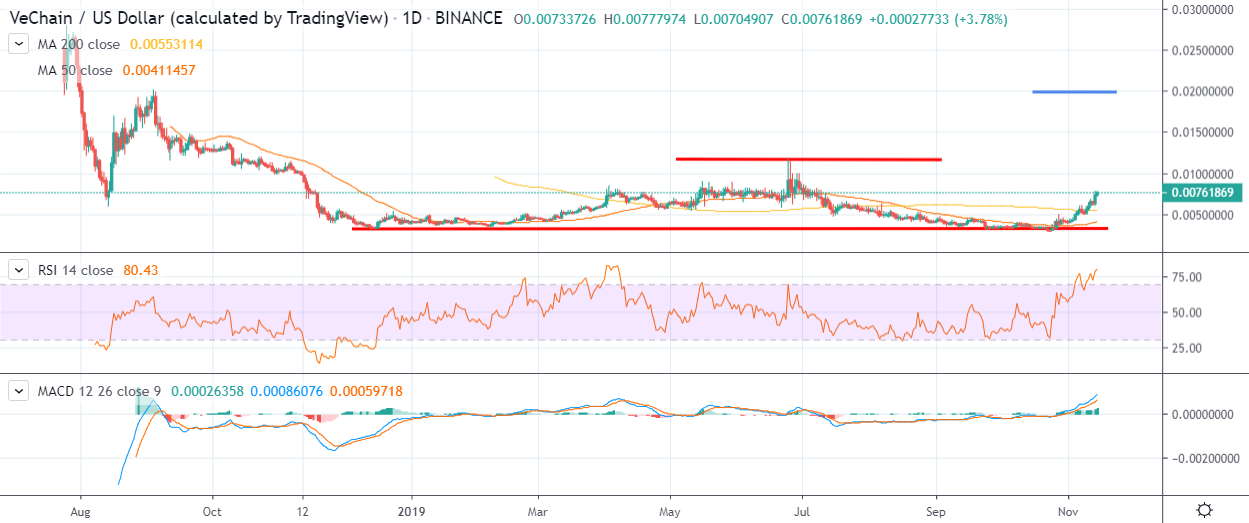
- The daily time frame is still showing a large head and shoulders pattern
VeChain is surging higher, with the VET / USD pair adding over 20% to its trading value, following a major bullish breakout above its 200-day moving average earlier this week.
The recent rally for Chinese projects has helped to underpin the firm bid tone behind the VET / USD pair, with the increasingly popular cryptocurrency now trading at its highest level since July 10th, this year.
After falling to a fresh all-time trading low last month, the turnaround in the VET / USD pair has been spectacular. The cryptocurrency now trades over 150% higher since October 24th and over 30% higher since the start of November.
The four-hour time frame shows that a bullish inverted head and shoulders pattern has been triggered, with the breakout remaining valid while price trades above the $0.0065 level.
The upside projection of the bullish pattern could take the VET / USD pair towards the $0.0095 level and possible higher if the upside momentum stays in place.
Looking at the daily time frame, a bearish head and shoulders pattern is still present, with VET / USD buyers needing to rally the cryptocurrency above the $0.0116 level to invalidate the pattern.
Going forward, an invalidation of the bearish head and shoulders pattern would be a strong statement of intent by VET / USD bulls, and a major bullish development over the medium-term.
According to the latest sentiment data from TheTIE.io, the short-term sentiment towards VeChain is bullish, at 76.00 %, while the overall long-term sentiment towards the cryptocurrency is also bullish, at 77.00%.
Upside Potential
The four-hour time frame shows that an inverted head and shoulders pattern has been triggered, with the $0.0095 level the near-term objective of the large bullish pattern.
Key technical resistance for the VET / USD pair above the $0.0095 level is currently located at the $0.0099 and $0.0116 levels.
Downside Potential
The four-hour time frame is showing that the VET / USD pair has strong short-term technical support around the $0.0065 level.
Key technical support for the VET / USD pair below the $0.0065 level is currently found at the $0.0058 and $0.0050 levels.
Summary
VeChain has tremendous short-term upside potential and looks set to continue its recent bullish breakout.
Going forward, VET / USD buyers must invalidate the bearish head and shoulders pattern to secure further medium-term gains.
For a quick look into VeChain and VET, check out our coin guide here.