
VeChain Price Analysis: Upcoming Resistance Test
VeChain had a sharp reversal of losses.
- VeChain has a bearish short-term and bullish medium-term trading outlook
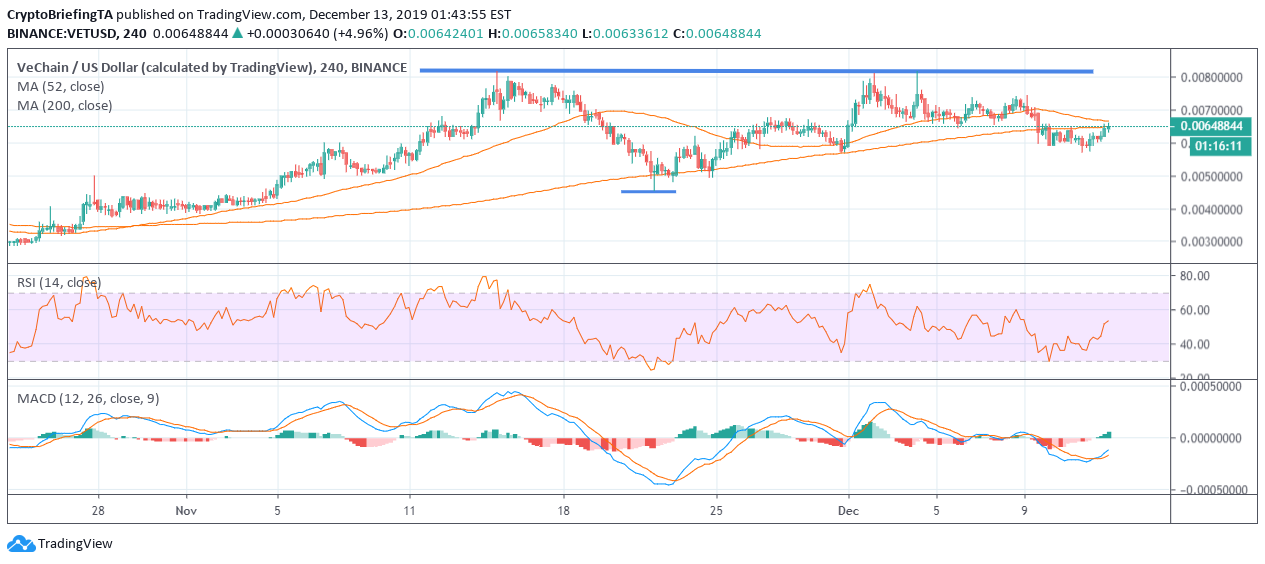
- The four-hour time frame shows that an inverted head and shoulders pattern has formed
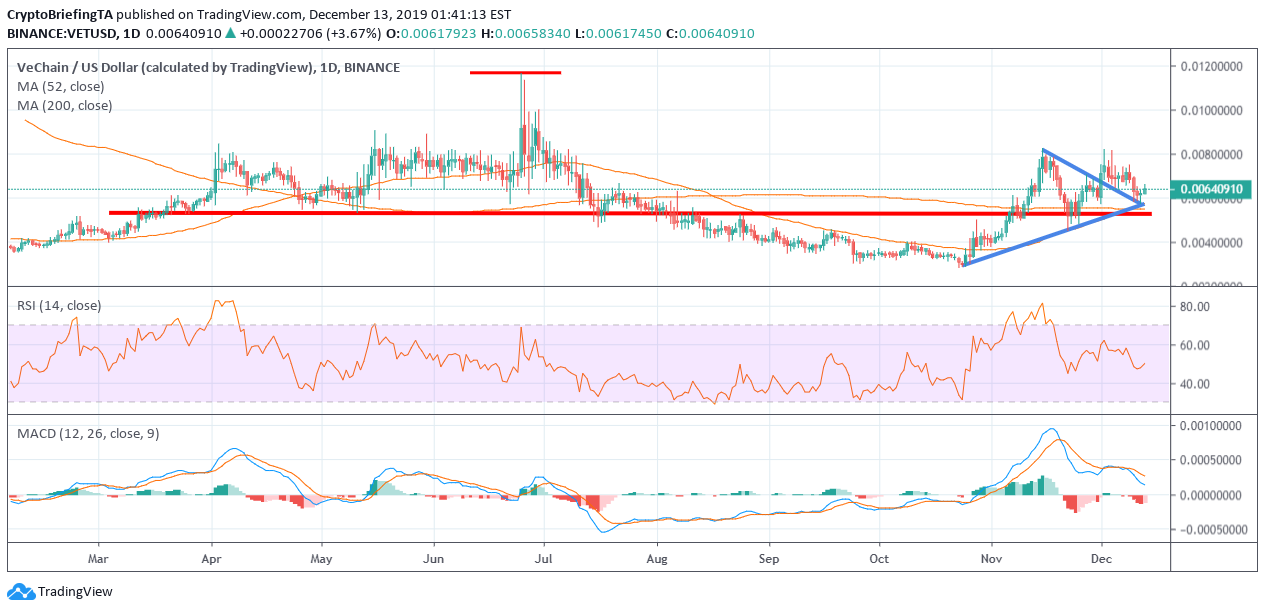
- The daily time frame continues to show a bullish triangle breakout underway.
VeChain is attempting to stage a recovery higher after reversing sharply from the 0.008 support level earlier this month. Technical analysis suggests the cryptocurrency could be preparing for its next major upside move.
The VET/USD pair is showing positive technical signs after forming a price floor around the 0.0057 level earlier this week. Continued gains towards the current December price high could prompt a major technical breakout.
The four-hour time frame shows that a large inverted head and shoulders pattern has taken shape during the recent rally, with its overall upside target located around the $0.0115 level.
A break above the $0.008 support should heighten technical buying toward the VET/USD pair, placing the psychological $0.01 level firmly in focus.
The daily time frame still shows a bearish head and shoulders pattern, although the cryptocurrency is trading above its trend defining 200-day moving average.
A bullish triangle breakout is still underway on the daily time frame, and is helping to support the medium-term bid in the VET/USD pair, alongside its technically bullish status.
Buyers need to rally price above the $0.012 level to invalidate the bearish pattern. If this scenario were to occur, the VET/USD pair could soar over the long-term.
The Relative Strength Index on the daily and time frame is bullish and still shows considerable upside potential before becoming overbought.
Upside Potential
The four-hour time frame shows that key technical resistance is now located at the $0.008 and $0.01 levels.
Key technical resistance over the medium-term is located at the $0.012 and $0.015 levels.
Downside Potential
The four-hour time frame is showing that the VET/USD pair has strong medium-term technical support around the $0.0057 and $0.005 levels.
Summary
Technical analysis suggests that the VET/USD pair could be preparing to test towards the November monthly price high.
The four-hour time frame is showing that the $0.0125 level remains a possible upside target.