 Earn with Nexo

Waves / USD Price Analysis: Destructive Interference
The earlier bullish breakout has been completely reversed as the pair keeps losing momentum.
- Waves has a bearish short-term outlook, with the cryptocurrency moving below its 200-period moving average
- The four-hour time frame is showing a bearish breakout from a descending triangle pattern
- Waves has turned bearish over the medium-term, with the WAVES / USD pair trading below its 200-day moving average
Waves / USD Short-term price analysis
Waves has a bearish short-term outlook, with the cryptocurrency now trading well below its 200-period moving average on the four-hour time frame.
The four-hour time frame is also showing a bearish breakout from a descending triangle pattern. The bullish breakout above the triangle pattern that occurred earlier this month now appears to be a false breakout.
Technical indicators across the four-hour time frame have turned bearish, although they now appear oversold.
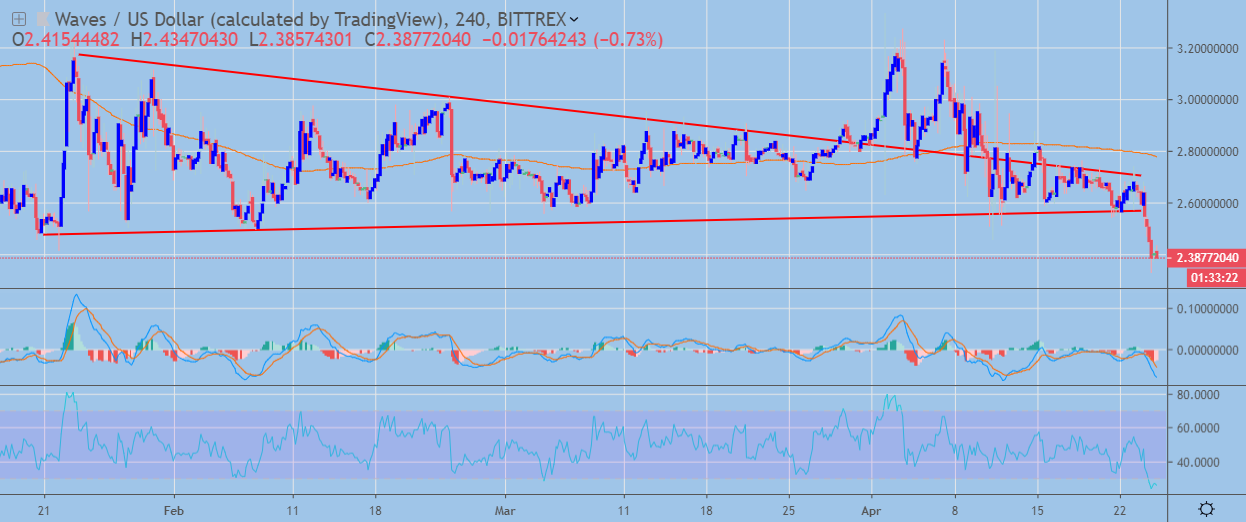 WAVES / USD H4 Chart by TradingView
Pattern Watch
Traders should note that a bearish head and shoulders pattern is now also visible across the four-hour time frame.
Relative Strength Index
The RSI indicator on the mentioned time frame is also bearish, although it is now extremely oversold.
MACD Indicator
The MACD indicator on the four-hour time frame is heavily bearish, with the MACD signal crossing issuing a strong sell signal.
Waves / USD Medium-term price analysis
Waves has a bearish medium-term outlook, with the cryptocurrency now technically bearish and trading below its 200-day moving average.
The daily time frame chart shows that the Waves/USD pair has now fallen below a symmetrical triangle pattern and remains vulnerable to further losses.
Technical indicators on the daily time frame have turned bearish and show scope for further downside.
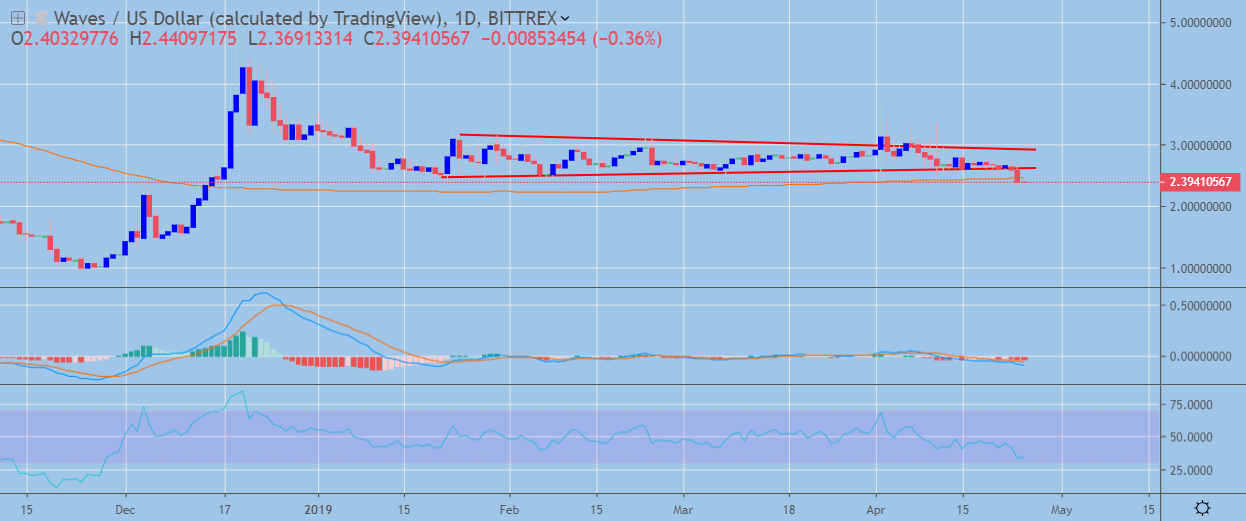 WAVES / USD Daily Chart by TradingView
Pattern Watch
Traders should note that following the bearish triangle breakout the Waves/USD pair has fallen to a new 2019 trading low.
Relative Strength Index
The RSI indicator on the daily time frame has also turned bearish and shows scope for further downside.
MACD Indicator
The MACD indicator has turned bearish on the daily time frame, with the MACD histogram and the MACD signal line both generating a clear sell signal.
Conclusion
Waves has now turned bearish across both time horizons, with the recent decline in the cryptocurrency forcing the Waves / USD pair into a much lower trading range.
The bearish patterns seen across the four-hour and daily time frames may lead to further losses towards the December 2018 trading low.
Check out our coin guide for Waves.
We wrote several analytical reports on Waves, including the initiation and updates.