
Shutterstock image by PopTika
XRP Poised for a 50% Move Defined by Two Crucial Price Levels
XRP remains stagnant as investors wait for a spike in volatility that allows them to determine where its price is heading next.
XRP approaches a pivotal point in its trend that could see a breakout in either direction.
XRP Prepares for High Volatility
XRP entered a consolidation phase after going through one of the most vicious pumps and dumps at the beginning of the month. Since then, this cryptocurrency has been making a series of lower highs and higher lows.
Such market behavior led to the formation of a symmetrical triangle on the 4-hour chart. A descending trendline line can be drawn along with the swing highs, while a rising trendline developed along with the swing lows.
As the sixth-largest cryptocurrency by market capitalization moves closer to the triangle’s apex, its price action has been contracting over time. The low volatility behind XRP helps identify two crucial price levels that will likely determine where it is headed next.
A 4-hour candlestick close above $0.64 or below $0.50 would be followed by a 55% move in that direction. This target is determined by measuring the height of the triangle’s y-axis and adding it to the breakout point.
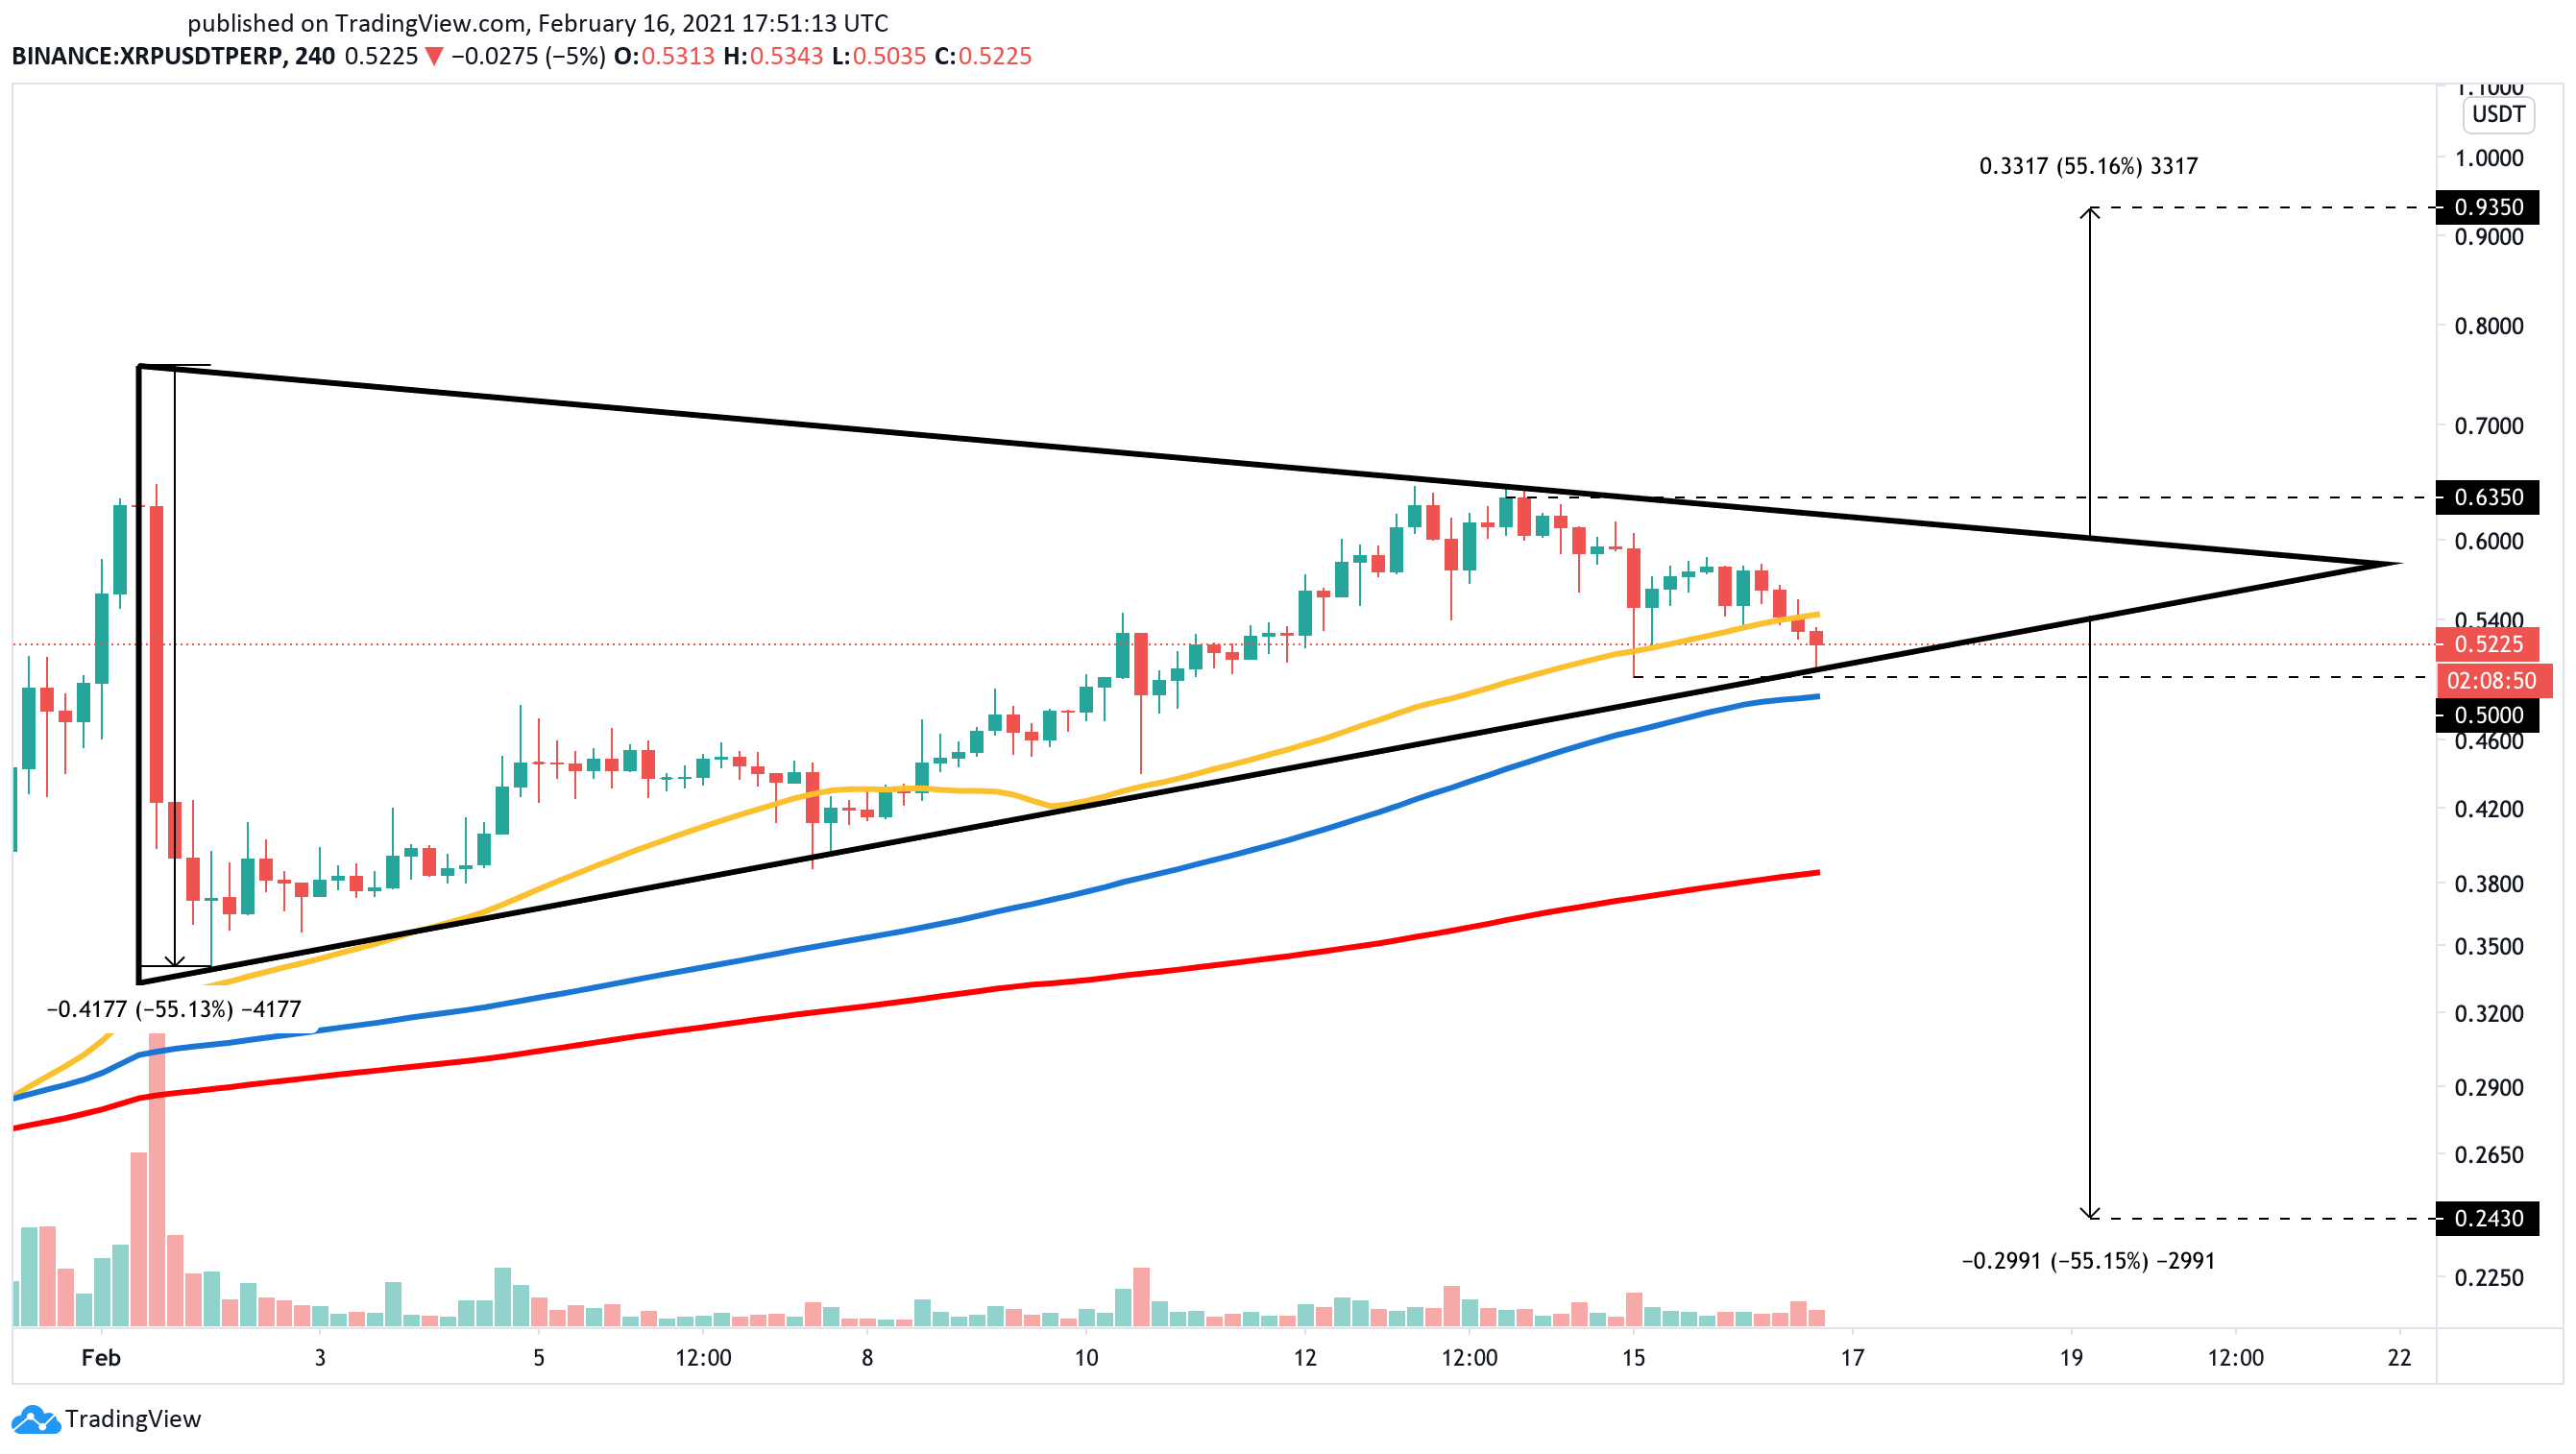
Despite the ambiguity that XRP presents, its price currently sits on top of the 100 four-hour moving average. This lagging indicator adds an extra layer of support to the triangle’s lower trendline, which may contain any downward pressure.
By bouncing off this critical support cluster, XRP will have a higher probability of retesting the $0.64 resistance and potentially break out towards $1.00.
Nonetheless, a spike in selling pressure pushingXRP below underlying support at $0.50 will likely bring on a downswing to the 200 four-hour moving average at $0.39 or even the symmetrical triangle’s target of $0.24.
Disclosure: At the time of writing, this author owned Bitcoin and Ethereum.