
Zilliqa Price Analysis ZIL / USD: Escaping With The Goods
Zilliqa maintains a constrained bullish bias within a horizontal price channel.
- Zilliqa has a bullish short-term trading bias, with the cryptocurrency still well supported on any moves lower
- The ZIL / USD pair has a bullish medium-term outlook with cryptocurrency still trading above its 200-day moving average
- The daily time frame is showing that price remains trapped within a horizontal price channel
Zilliqa / USD Short-term price analysis
Zilliqa has a bullish short-term outlook, with the cryptocurrency still trading well above its 200-period moving average on the four-hour time frame.
The four-hour time frame shows that price has bounced sharply higher from the ZIL / USD pair’s 200-period moving average and is now testing back towards the neckline of an inverted head and shoulders pattern.
Technical indicators across the four-hour time frame have turned bullish and continue to generate a buy signal.
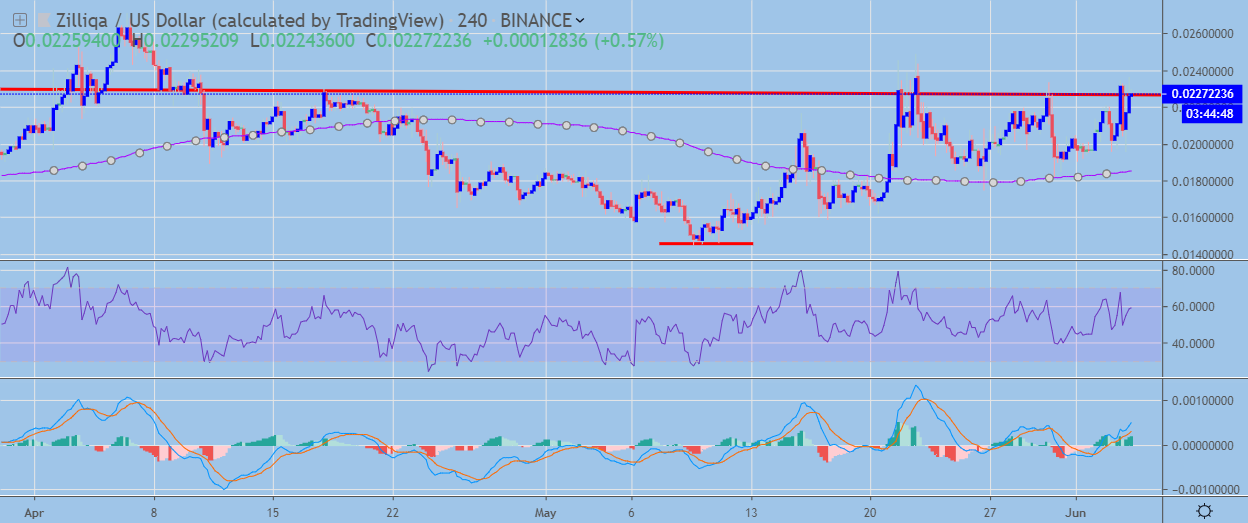 ZIL / USD H4 Chart by TradingView
Pattern Watch
Traders should note that an even larger inverted head and shoulders pattern could start to form on the four-hour time frame.
Relative Strength Index
The RSI indicator is bullish on the four-hour time frame and is highlighting the growing short-term bullish pressure.
MACD Indicator
The MACD indicator is bullish on the four-hour time frame and continues to issue a strong buy signal.
Zilliqa / USD Medium-term price analysis
Zilliqa has a bullish medium-term trading bias, with the cryptocurrency recovering back above its trend defining 200-day moving average.
The daily time frame is showing that the ZIL / USD pair remains trapped within a large horizontal price channel that has been in place since the start of 2019.
Technical indicators on the daily time frame remain bullish and continue to show scope for further upside gains.
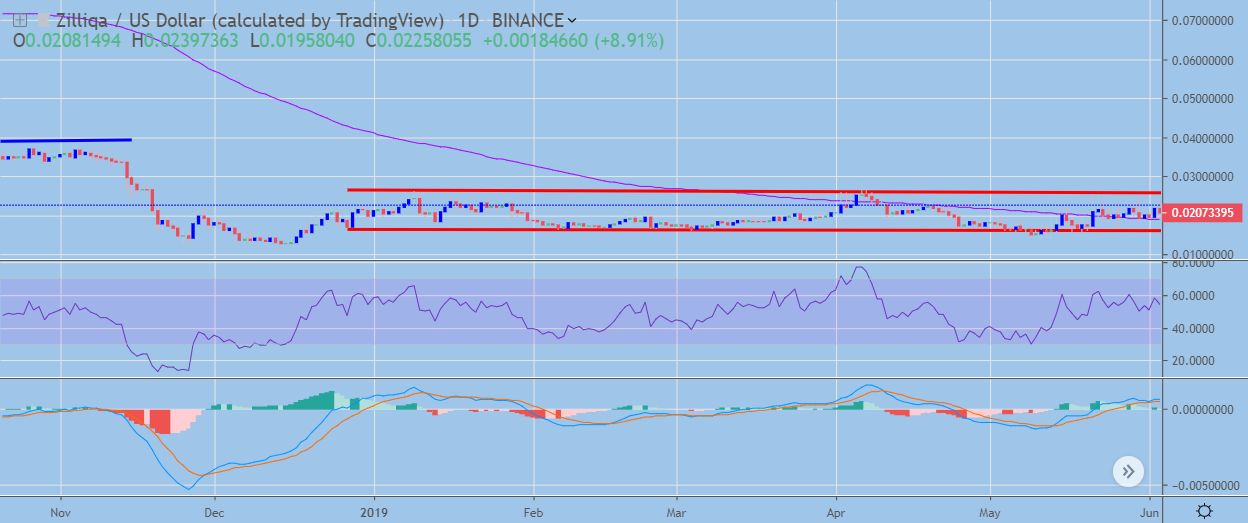 ZIL / USD Daily Chart by TradingView
Pattern Watch
Traders should note that the October 2018 swing-high is the projected bullish target if a technical breakout occurs from the horizontal price channel.
Relative Strength Index
The Relative Strength indicator is bullish on the daily time frame and continues to issue a buy signal.
MACD Indicator
The MACD indicator is bullish on the daily time frame, with the MACD signal line still issuing a buy signal.
Conclusion
Zillaqa remains well supported on any moves lower, with the bullish pattern on the four-hour time frame highlighting that the cryptocurrency can still trade much higher over the short-term. If ZIL / USD bulls can ignite the bullish pattern it is likely that we will see a technical test towards the top of the horizontal price channel on the daily time frame.
Check out our coin guide for Zilliqa for a brief overview.
We also published a deeper overview of the project in our Zilliqa DARE.