
Zilliqa Price Analysis ZIL / USD: Riding On Chainlink
Integrating Chainlink was a (small) boon for Zilliqa.
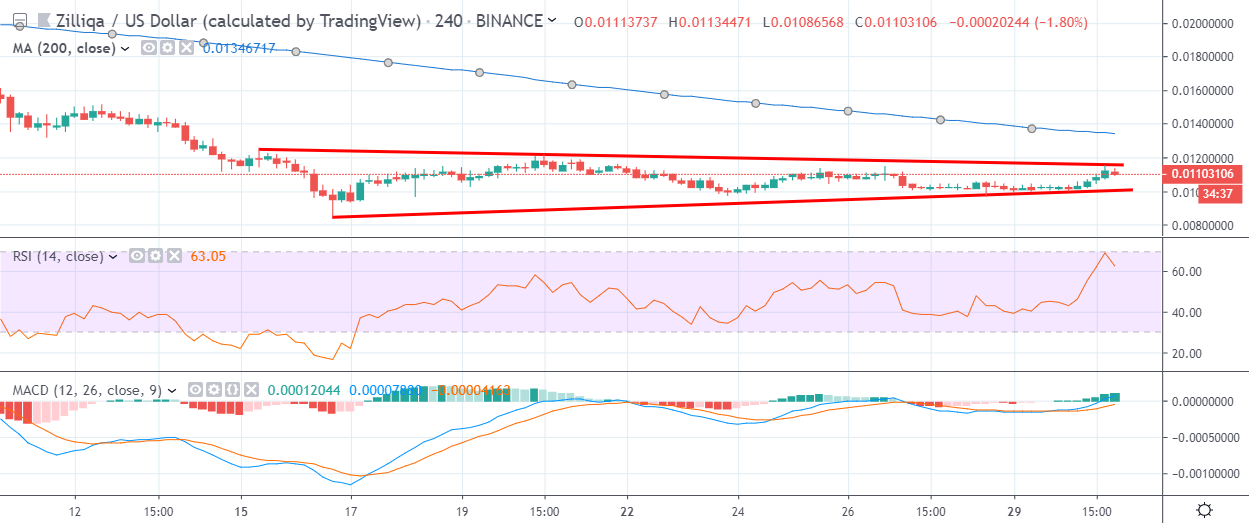
- Zilliqa has a bearish short-term trading outlook, with the cryptocurrency still trading below its 200-period moving average on the four-hour time frame
- The four-hour time frame shows that the ZIL / USD pair still remains trapped within a wedge pattern
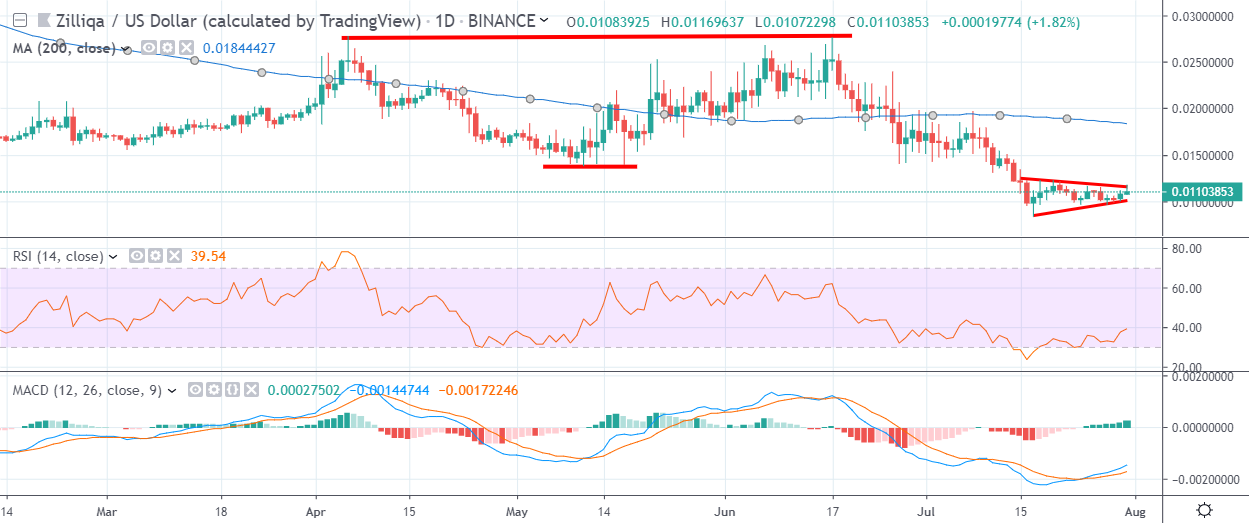
- The daily time frame continues to show the invalidation of a large inverted head and shoulders pattern
Fundamental Analysis
Zilliqa has gained bullish momentum after the project announced that it is planning to integrate Chainlink’s decentralized oracle solution. This will enable access to real-time information for Zilliqa’s smart contracts and expand the functionality of its network.
Zilliqa / USD Short-term price analysis
Zilliqa has a bearish short-term outlook, with the cryptocurrency still trading below its 200-period moving average on the four-hour time frame.
The four-hour time frame shows that despite the recent rally in the ZIL / USD pair, the price still remains trapped within a narrowing wedge pattern.
Technical indicators across the four-hour time frame are bullish and continue to issue buy signals.
Pattern Watch
Traders should note that a bullish wedge breakout will likely prompt an important test of the ZIL / USD pair’s 200-period moving average.
Relative Strength Index
The RSI indicator is bullish on the four-hour time frame, although it is starting to correct from overbought conditions.
MACD Indicator
The MACD indicator is bullish on the four-hour time frame and continues to generate a strong buy signal.
Zilliqa / USD Medium-term price analysis
Zilliqa has a bearish medium-term outlook, with the cryptocurrency still trading below key resistance on the daily time frame.
The daily time frame continues to show an invalidated inverted head and shoulders pattern, with the recent downside breakout yet to reach its bearish target.
Technical indicators on the daily time frame are attempting to turn bullish and are currently failing to generate a clear trading signal.
Pattern Watch
Traders should note that a wedge pattern is also present on the daily time frame.
Relative Strength Index
The Relative Strength indicator is rising on the daily time frame, although it still remains technically bearish.
MACD Indicator
The MACD indicator is rising and is now starting to generate a buy signal on the daily time frame.
Conclusion
Despite the recent upside move, Zilliqa still remains in a vulnerable position technically across the four-hour and daily time frame.
The invalidation of the bullish pattern on the daily time frame suggests that the ZIL / USD pair has yet to find a meaningful price floor.
Check out our coin guide for Zilliqa for a brief overview.
We also published a deeper overview of the project in our Zilliqa DARE.