
Binance Coin Price Analysis BNB / USD: Heating Up Again
Development hiccups and a USA ban are balanced by ever more features.
- Binance Coin has a bullish short-term bias, with the cryptocurrency probing towards its all-time trading high
- The four-hour time frame is showing a large inverted head and shoulders pattern
- The daily time frame is showing that a major bullish breakout has occurred
Fundamental Analysis
Last week Binance announced that it will stop serving U.S. traders, which caused BNB price to suffer a major fall. However, it has been recovering on the strength of positive ecosystem news.
First, Binance announced that it is planning to issue a number of tokens pegged to leading cryptocurrencies on Binance Chain. This will boost the number of trading options on Binance.com and should also increase liquidity on Binance DEX.
Second, the exchange is planning to launch a regulatory-compliant fiat-to-crypto market in the United States.
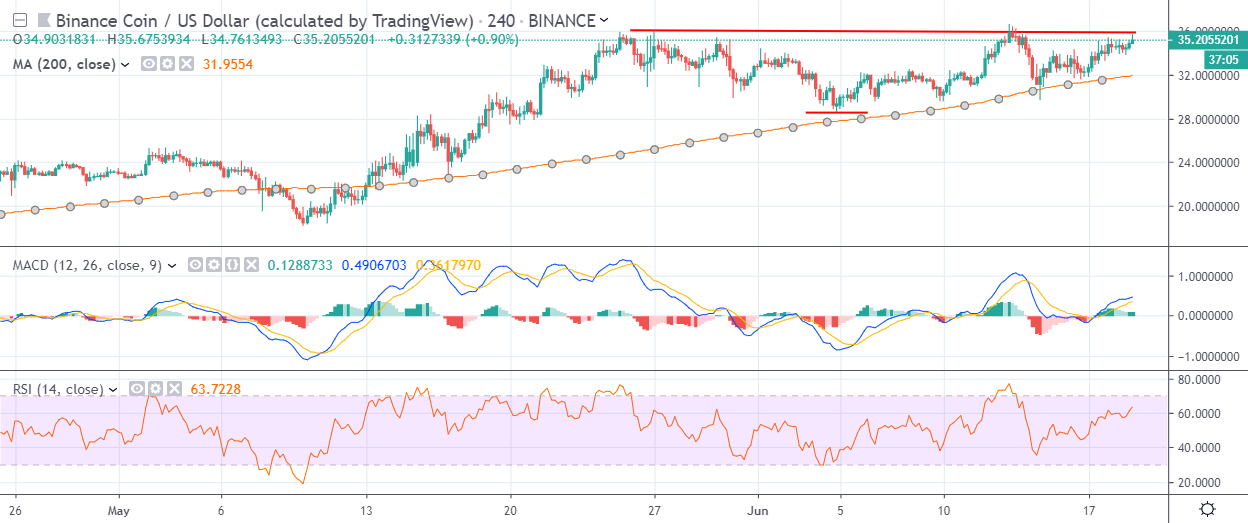
Binance Coin / USD Short-term price analysis
Binance Coin has a bullish short-term outlook, with the cryptocurrency probing back towards its all-time record price high.
The four-hour time frame shows that a complex inverted head and shoulders pattern is starting to form, with the BNB / USD pair testing towards the neckline of the bullish pattern.
Technical indicators on the four-hour time frame have turned bullish and still generating a buy signal.
Pattern Watch
Traders should note that the BNB / USD pair could gain more than twenty percent if the bullish inverted head and shoulders pattern on the four-hour time frame reaches its full upside potential.
Relative Strength Index
The RSI Indicator is bullish on the four-hour time frame and shows scope for further upside.
MACD Indicator
The MACD indicator on the four-hour time frame is bullish, with the MACD signal line issuing a strong buy signal.
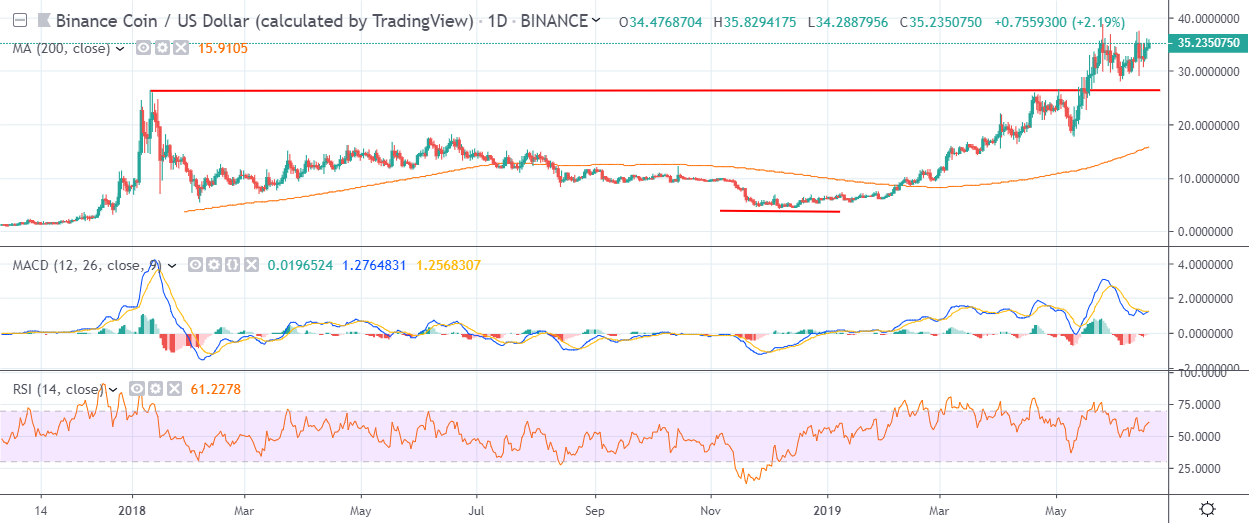
Binance Coin / USD Medium-term price analysis
Binance Coin has a bullish medium-term outlook, with the daily time frame highlighting that a valid technical breakout remains in play.
The daily time frame is showing that the BNB / USD pair continues to trade above the neckline of a large inverted head and shoulders pattern, which still has significant upside potential.
Technical indicators are mixed on the daily time frame and are attempting to turn bullish.
Pattern Watch
Traders should note that the BNB / USD pair could gain more than eighty percent if the bullish inverted head and shoulders pattern reaches its full upside potential.
Relative Strength Index
The RSI indicator is bullish on the daily time frame and shows scope for further upside.
MACD Indicator
The MACD indicator on the daily time frame is attempting to turn bullish as medium-term upside pressures builds.
Conclusion
Binance Coin remains extremely well supported on any technical pullbacks, with the bullish pattern on the four-hour time frame highlighting that another major upside breakout could soon occur.
Medium-term BNB / USD bulls still remain in full control, with the bullish pattern on the daily time frame warning that the cryptocurrency can still trade much higher.
Check out our coin guide for BNB to understand how it works.
We also conducted a deep analysis of the Binance Exchange token in our DARE.