
Shutterstock cover by Martin Mecnarowski
Bitcoin Closing in on Biggest Monthly Dip Since 2011
Bitcoin is en route to its worst monthly close in a decade.
Bitcoin is down over 36% in May with hours left until the monthly closing. Ethereum has dipped 9% this month.
Bitcoin’s Big Correction
Bitcoin looks like it’s about to close its biggest monthly dip since 2011.
Bitcoin is down 40% from record highs recorded in April, while Ethereum is roughly 42.4% off its all-time high. The correction has been particularly notable over the last two weeks after the market suffered its heaviest drop since Mar. 2020 earlier this month.
Bitcoin broke support around $45,000 in the second week of May, leading to a massive sell-off due to cascading liquidations. It hit lows of around $30,000.
Bitcoin first dropped below $50,000 on May 12 after a three-month consolidation. The sell-off was initiated by spot sellers and later intensified due to liquidations in the futures market.
On May 19, the sell-off reached its peak, causing cascading liquidations across the futures market and in DeFi positions.
The total Open Interest (OI) volume of the derivatives market at the beginning of the month was $31.1 billion. Nearly $12.2 billion has been wiped out from the futures and perpetual swaps in May.
According to data from Glassnode, 76.5% of the Bitcoin supply is in profit. In other words, 76.5% of circulating coins are at a higher price than when they were last moved. The metric acts as a proxy for a top and bottom indicator; a 99% supply in profit suggests a top, while a 40% supply in profit often marks a bottom.
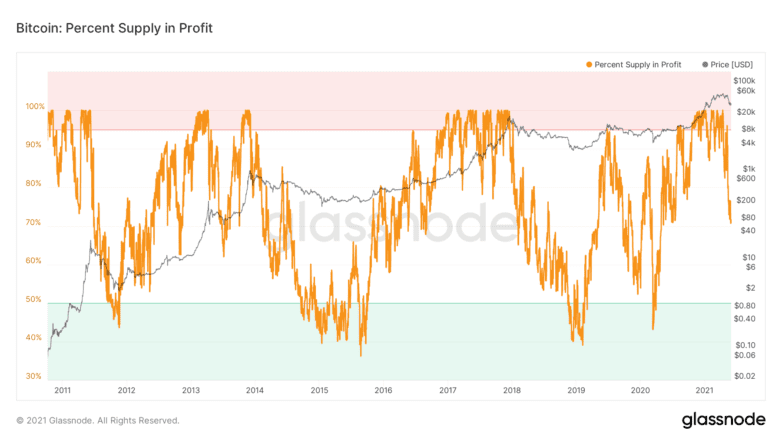
The 76.5% figure is around the mid-range.
On the other hand, nearly 94% of the ETH supply is in profit. The key levels to watch for ETH are 99% for a top and 25% for a bottom.
There is some optimism across the market due to the rising inflation rates for Bitcoin and the development of the DeFi sector. However, the fear of a long-term bear market is palpable among participants.
A Shift in Sentiment
The change in sentiment has been particularly noticeable in recent weeks.
One of the biggest concerns is the resemblance the latest crash has with previous bear markets.
Bitcoin has recorded monthly drawdowns of around 30% on eight occasions, though the recent one is the biggest dip since 2011. These events can be divided into six phases, representing a long-term trend reversal in the market. Six of the drawdowns marked a bottom, while only two marked a top. Nonetheless, this month’s one bears a stronger resemblance to the top signals.
A closer look suggests that it looks similar to Jun. 2013 and Jan. 2018, which have contrasting implications.
Bitcoin’s price closed in the red in both May and Jun. 2013, with a total drop of 35.6%. However, the price ended the year up 5,428%, suggesting that the current price could run higher too.
In Jan. 2018, a month after Bitcoin’s peak of almost $20,000, it recorded a 26.9% fall. In March and November of the same year, it fell more than 30%, ending the year 73.4% lower. The tops in late 2013 and 2017 preceded multiple months in the red.
The bulls need to hold current levels and avoid another big drawdown in the coming months to avoid the long-term negative trend as it has in the past two times in 2014 and 2018.