
Shutterstock photo by Chanthanee
Bitcoin, Ethereum, and XRP Are Primed for Higher Highs
The three leading cryptocurrencies appear to be building momentum before their next leg up.
A spike in profit-taking seems to have pushed Bitcoin, Ethereum, and XRP into a consolidation period. Still, these digital assets are expected to resume their respective uptrend soon.
Bitcoin Consolidates Before Higher Highs
Bitcoin has been dormant after rising to a new all-time high of nearly $62,000 in mid-March. The stagnation phase led to the formation of an inverse head-and-shoulders pattern on its 4-hour chart.
At the time of writing, BTC is creating the right shoulder of a bullish formation. Based on the left shoulder’s height, Bitcoin prices could decline before a potential breakout. A downswing towards the 38.2% or 23.6% Fibonacci retracement level would make the inverse head-and-shoulders pattern more symmetrical.
These crucial support levels sit at $54,570 and $52,960.
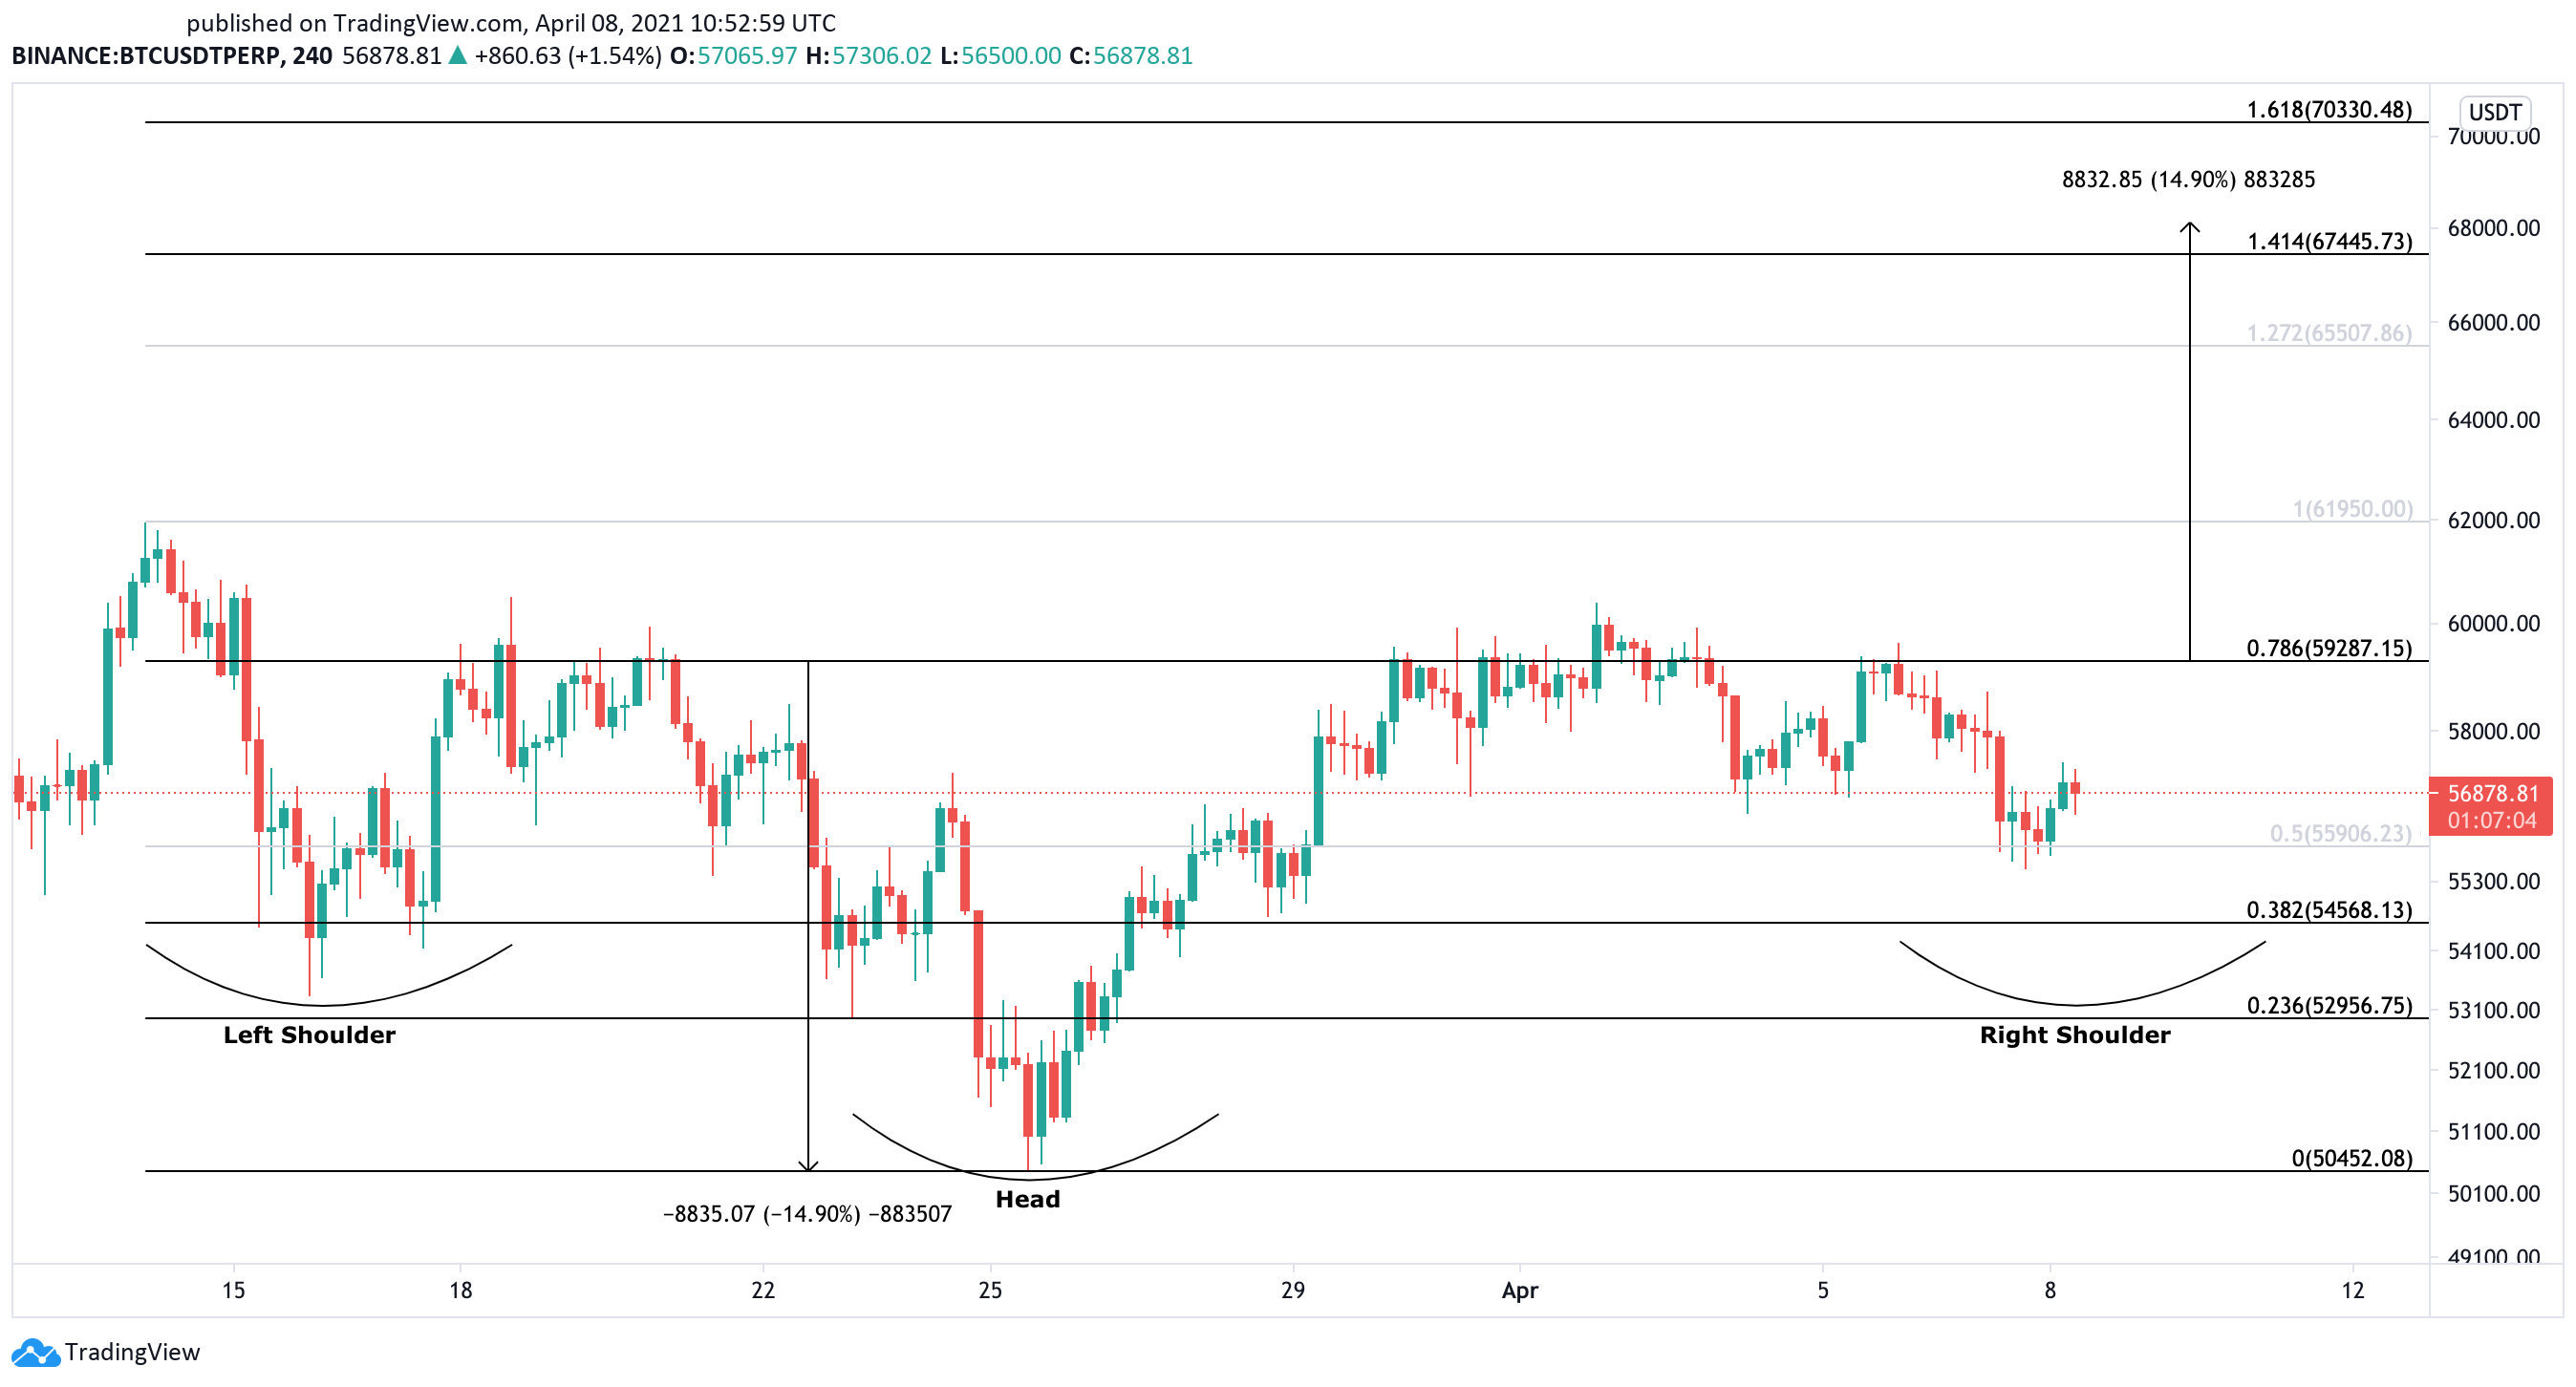
Though it is highly probable that Bitcoin’s price will decline before it sees higher highs, inverse head-and-shoulders patterns do not necessarily need to be symmetrical.
It is imperative to pay close attention to the pattern’s neckline or the 78.6% Fibonacci retracement level at $59,290 in case an early breakout occurs. If Bitcoin manages to close decisively above this price hurdle, a 14.90% upswing can be expected towards the 141.1% or 161.8% Fibonacci retracement level.
These interest areas sit at $67,450 and $70,330, respectively.
Such a bullish target is determined by measuring the height between the neckline and the head of the inverse head-and-shoulders pattern and adding that distance to the breakout point.
Ethereum Targets New All-Time Highs
Ethereum endured a month-long consolidation period during which its price hit a series of lower highs and lower lows. This behavior led to the formation of a symmetrical triangle on its 4-hour chart.
Ethereum was able to break out of this pattern on Mar. 31, rising by nearly 16% to reach a new all-time high of $2,160.
Although Ether took a 10.70% nosedive after the peak, it still has more room to go up. The height of the triangle’s y-axis suggests that ETH could surge by another 18% from the recent high towards the 141.1% or 161.8% Fibonacci retracement level.
These potential bullish targets sit at $2,480 and $2,720, respectively.
Regaining the $2,050 resistance as support can be perceived as the first confirmation signal that Ethereum is primed for higher highs.
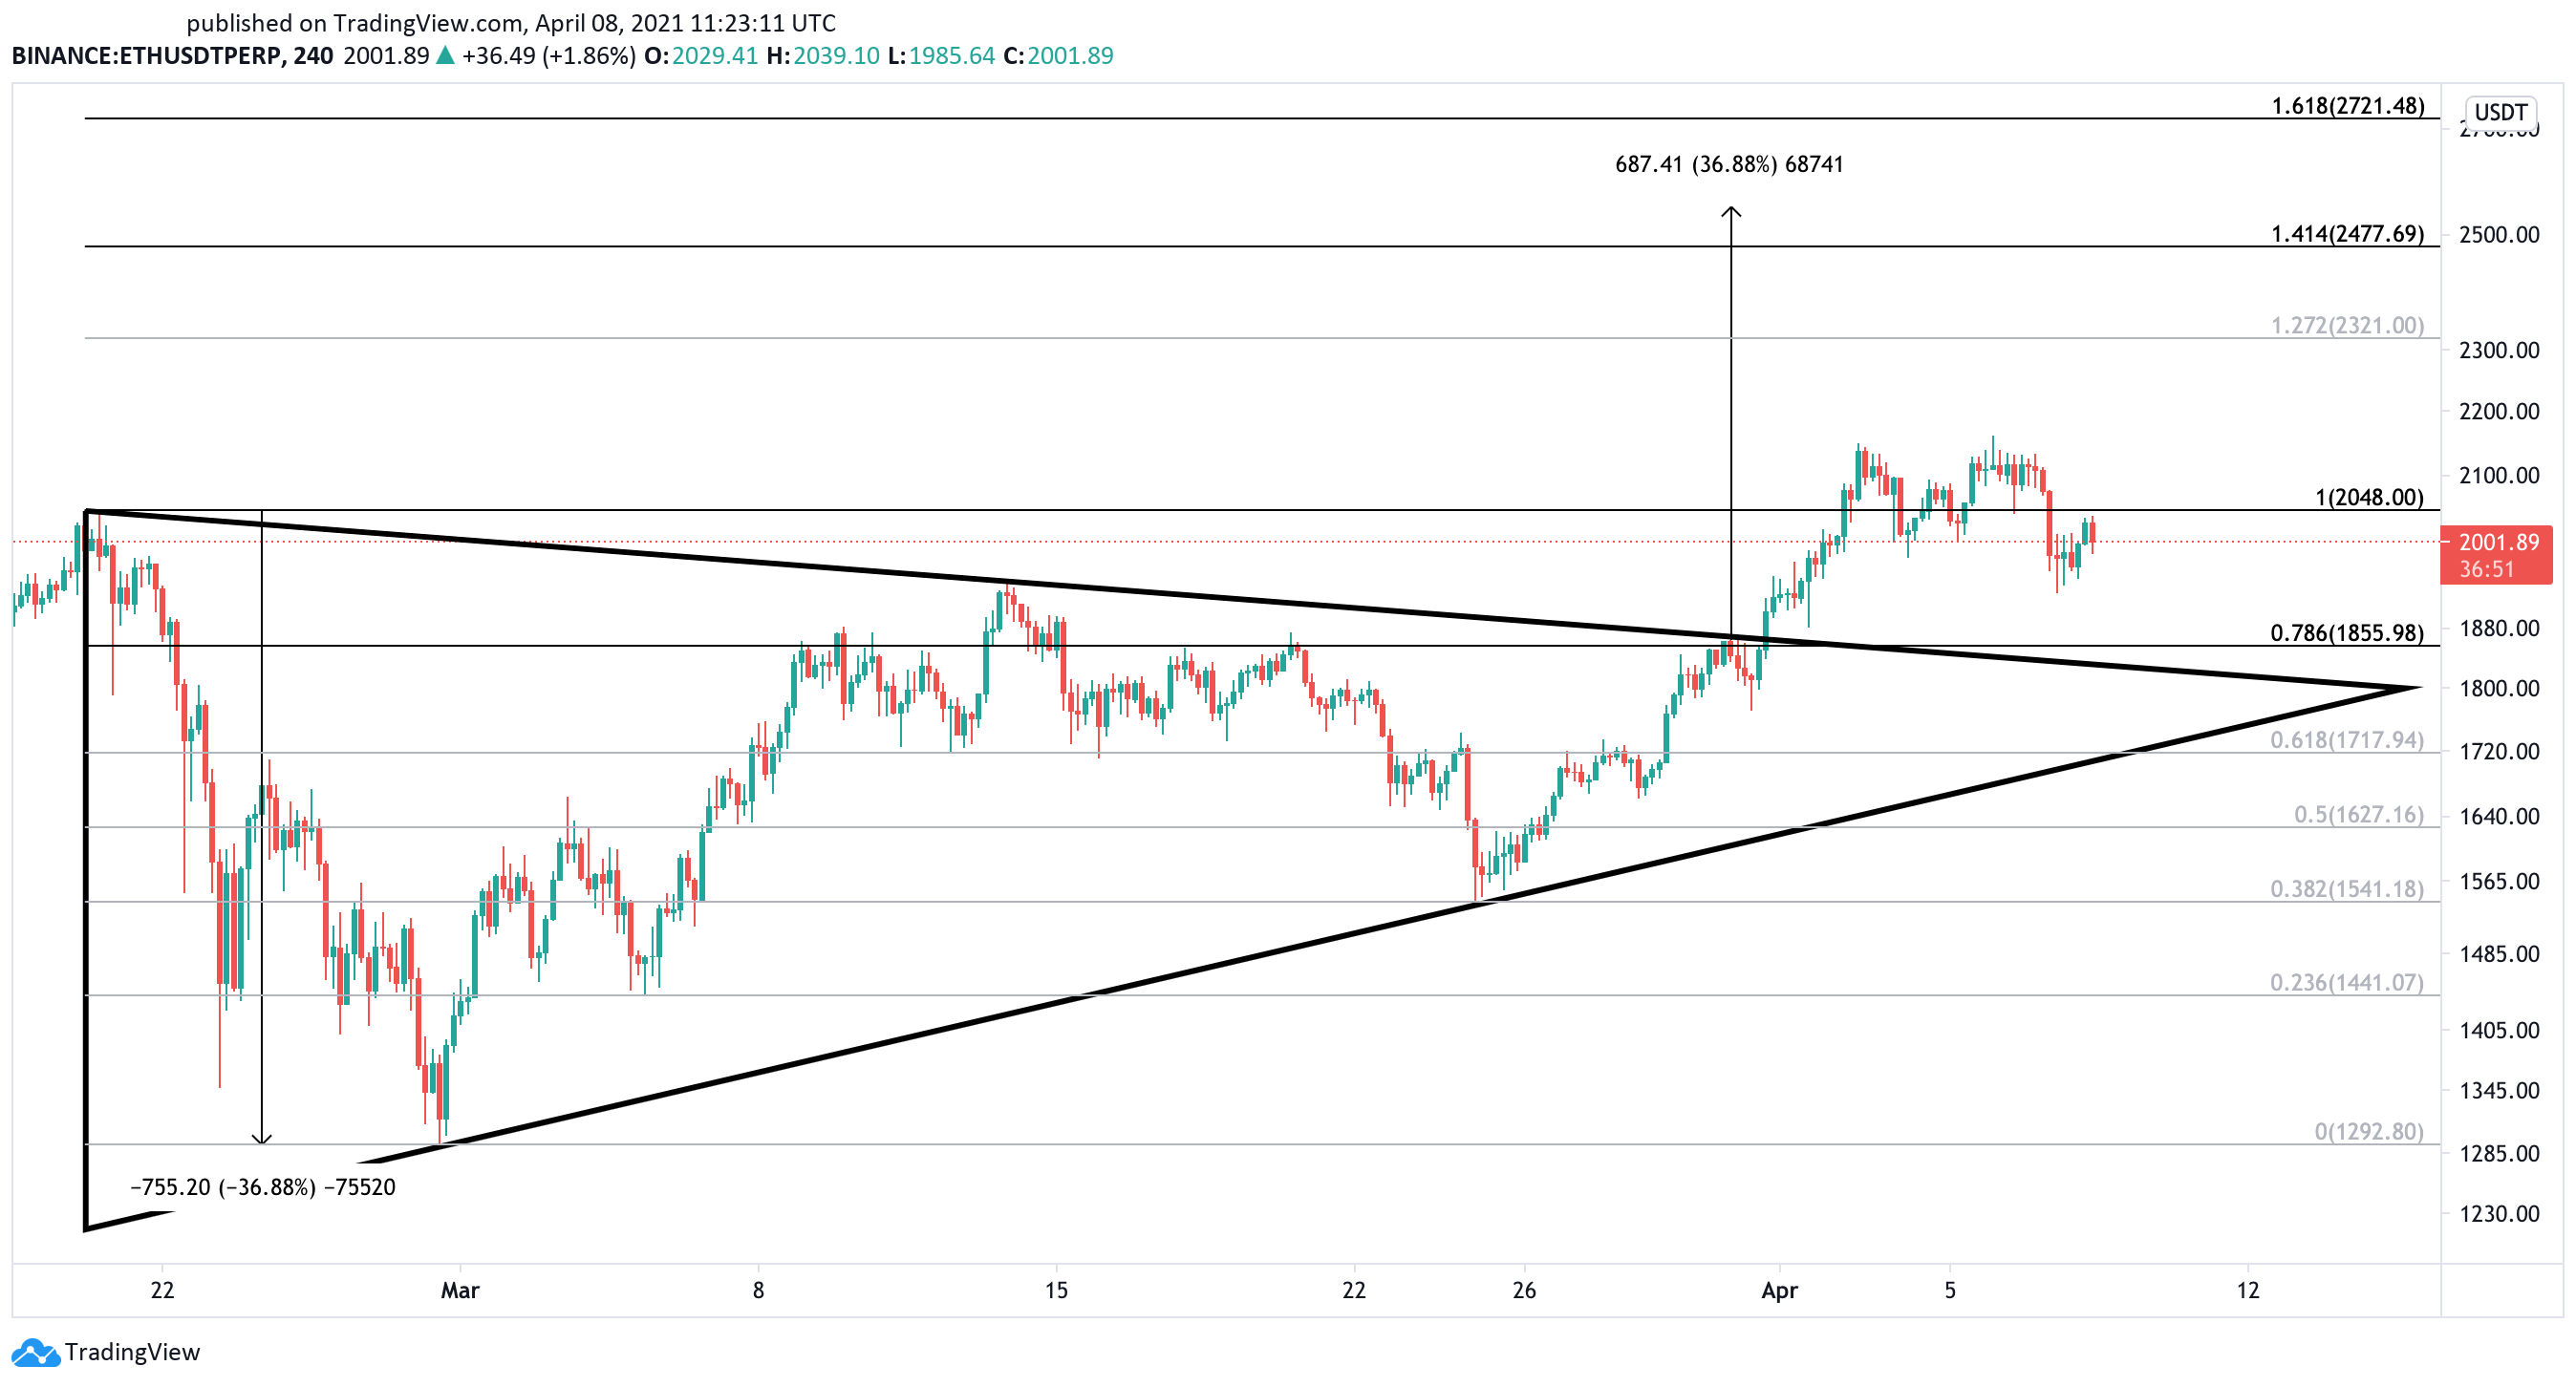
It is worth noting that a rejection from the $2,050 resistance level could result in a pullback to the 78.6% Fibonacci retracement level at $1,860. This level coincides with the triangle’s breakout point.
A potential correction to the $1,860 support level could be considered a valid retest of the triangle’s upper trendline, assuring that the breakout is reliable and trustworthy. It also provides sidelined investors an opportunity to reenter the market, adding upward pressure for the targets to be met.
XRP Primed to Resume Uptrend
Ripple’s XRP made headlines after breaking out of an inverse head-and-shoulders that saw it rise above $1.00 for the first time since mid-February 2018. Following the explosive price action, XRP entered a consolidation phase on the 1-hour chart.
The short-term lackluster price action seen after the peak on Apr. 6 seems to be creating the pennant of a bull pennant formation. Meanwhile, the 100% upswing seen after Apr. 4 appears to have developed the pattern’s flagpole.
Another spike in buying pressure that allows XRP to slice through the pennant’s upper trendline or the 78.6% Fibonacci retracement level at $1.00 will signal a potential breakout.
Under such unique circumstances, this cryptocurrency could surge by nearly 50% towards the 127.2% or 141.4% Fibonacci retracement level. These resistance barriers sit at $1.36 and $1.50, respectively.
The bullish target is determined by measuring the flagpole’s height and adding that distance to the breakout point.
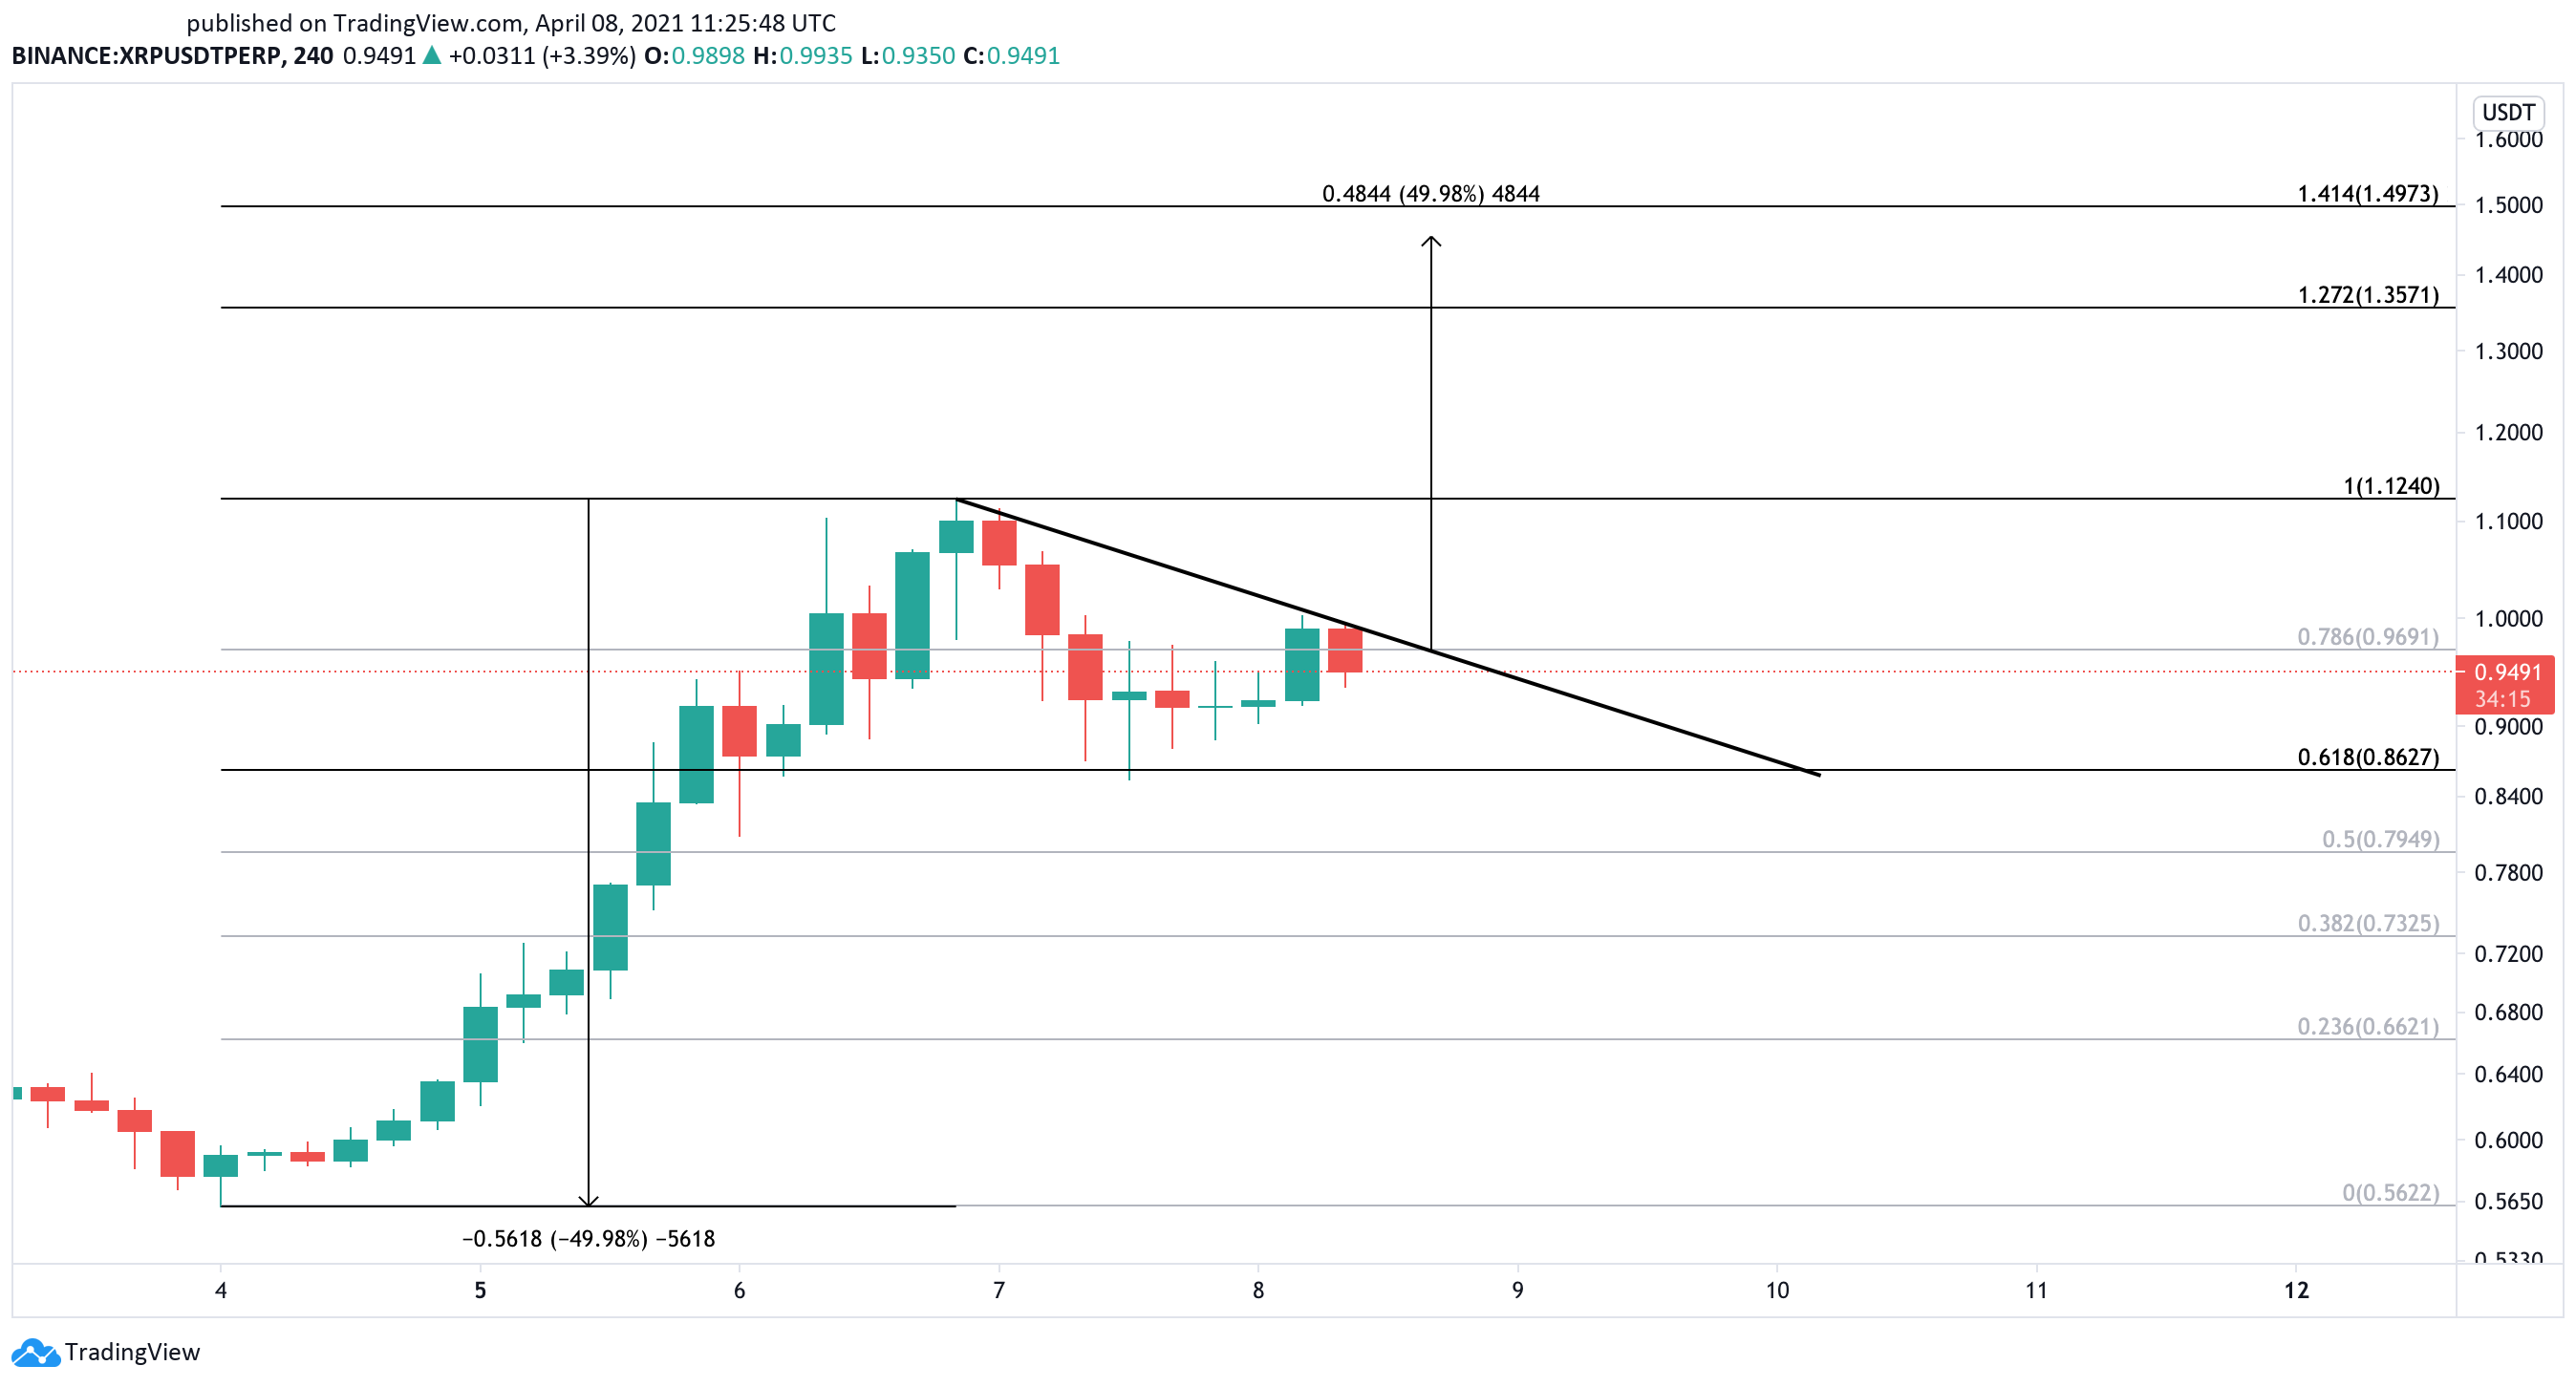
While the odds seem to favor the bulls, investors must note that XRP needs to hold above the 61.8% Fibonacci retracement level at $0.86.
Failing to do so could invalidate the optimistic outlook and lead to a correction to the 38.2% or the 23.6% Fibonacci retracement level. These support levels sit at $0.73 and $0.6f6, respectively.
Disclosure: At the time of writing, this author owned Bitcoin and Ethereum.