
Chainlink Price Analysis LINK / USD: Coinbase, Lift With Caution
Coinbase listing adds to a series of good news.
- Chainlink has a bullish short-term bias, with the LINK / USD pair holding towards its all-time high
- The four-hour time is now showing that bulls are in full control of price action
- The daily time frame is showing that a bullish pattern is close to reaching its upside objective
Fundamental Analysis
Chainlink’s uptrend momentum remains strong. Today the project announced its listing on Coinbase Pro. Trading will be available in all Coinbase Pro jurisdictions, with the exception of New York State. This will add additional liquidity to the coin, and increase the potential user base for the project.
Chainlink / USD Short-term price analysis
Chainlink has a bullish short-term trading outlook, with the cryptocurrency rallying to yet another record high.
The four-hour time frame is now showing that bulls are in full control of price action, with the latest move higher in the LINK / USD pair invalidating a bearish head and shoulders pattern.
Technical indicators on the four-hour time frame are still issuing buy signals.

Pattern Watch
Traders should note that the bullish inverted head and shoulders pattern on the four-hour time frame is close to reaching its upside target.
Relative Strength Index
The RSI indicator on the four-hour time frame is still bullish, despite undergoing a minor correction from overbought conditions.
MACD Indicator
The MACD indicator on the four-hour time frame is bullish and continues to issue a buy signal.
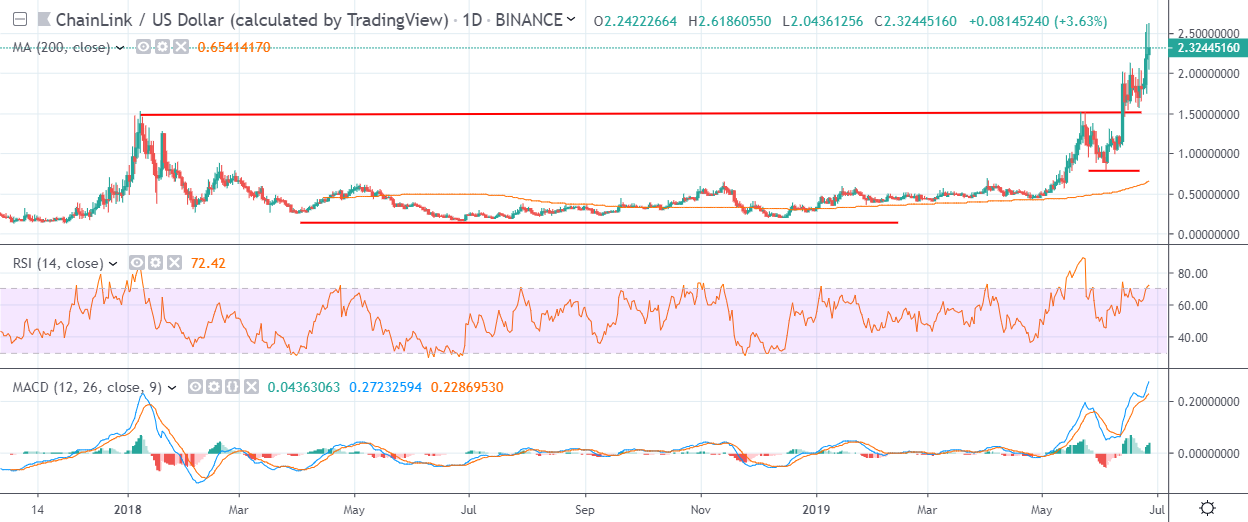
Chainlink / USD Medium-term price analysis
The LINK / USD has a bullish medium-term trading outlook, with the cryptocurrency continuing its major bullish breakout.
The daily time frame is showing that the LINK / USD pair has almost doubled in value since buyers ignited the bullish inverted head and shoulders pattern.
Technical indicators on the daily time frame remains bullish and continue to issue buy signals.
Pattern Watch
Traders should note that the overall upside target of the bullish pattern on the daily time frame has nearly been achieved.
Relative Strength Index
The RSI indicator on the daily time frame remains bullish, although it is approaching overbought territory.
MACD Indicator
The MACD indicator on the daily time frame is bullish, with both the MACD signal line and MACD histogram still issuing a buy signal.
Conclusion
Chainlink buyers have finally ignited the inverted head and shoulders pattern on the daily time frame, causing the LINK / USD pair to soar to a new all-time trading high.
Given the incredible run higher and the bullish patterns on both time frames nearing completion, traders should be on guard for a possible technical correction lower.
Find out more about Chainlink in our coin guide.