
Chainlink Price Analysis LINK / USD: Mainnet Euphoria
Chainlink's strong technical indicators are being catalyzed by a mainnet launch announcement.
- Chainlink is bullish in the short-term, with the LINK / USD pair advancing to a new 2019 trading high
- The bullish inverted head and shoulders pattern has now been triggered across the four-hour time frame
- The daily time frame is showing that the cryptocurrency has now broken above major trendline resistance
Chainlink / USD Short-term price analysis
Chainlink has a bullish short-term trading outlook, with the cryptocurrency advancing to its highest trading level since February 2018.
The four-hour time frame is showing that the inverted head and shoulders pattern has been triggered with the bullish pattern reaching its initial upside target.
Technical indicators on the four-hour time frame are still bullish, although they are now starting to appear overstretched.
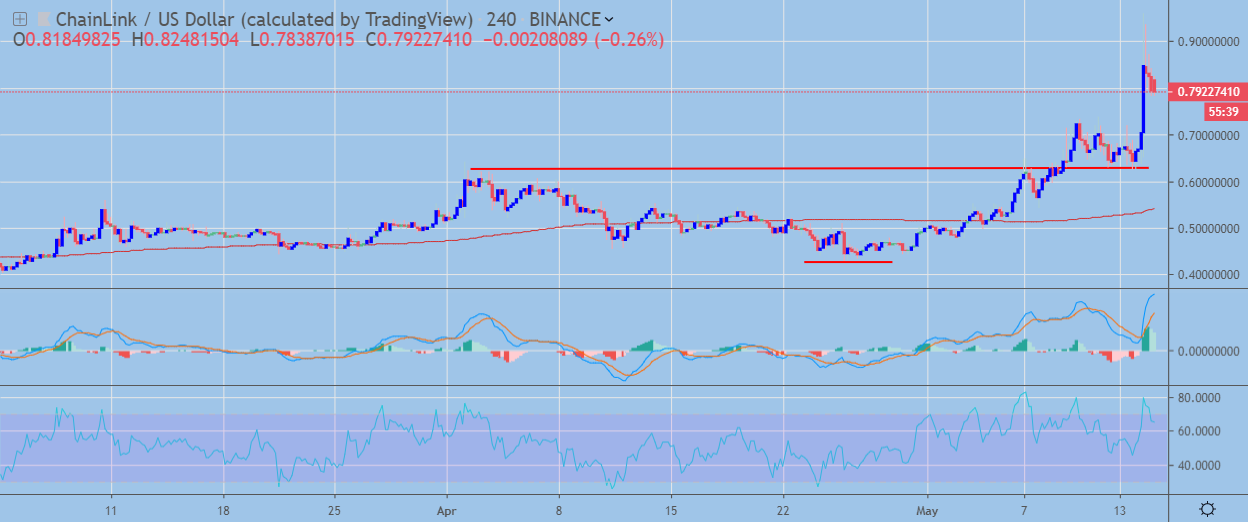 LINK / USD H4 Chart by TradingView
Pattern Watch
Traders should note that a bearish correction may take place now that the inverted head and shoulders pattern on the four-hour time frame has reached its bullish target.
Relative Strength Index
The RSI indicator on the four-hour time frame remains bullish, although it is now correcting from overbought conditions.
MACD Indicator
The MACD indicator on the four-hour time frame is bullish, although it now appears overstretched.
Fundamental Analysis
LINK surged after the announcement that it will launch its decentralized Oracle platform on the Ethereum mainnet on May 30. The platform also announced plans to deploy additional blockchain networks.
Chainlink / USD Medium-term price analysis
The LINK / USD has a bullish medium-term trading outlook, with the cryptocurrency breaking above towards major trendline resistance on the daily time frame.
The daily time frame is showing that a large head and shoulders pattern remains valid, with bulls needing to rally the LINK / USD pair to a new all-time trading high to invalidate the bearish pattern.
Technical indicators on the daily time frame have turned bullish and continue to issue a strong buy signal.
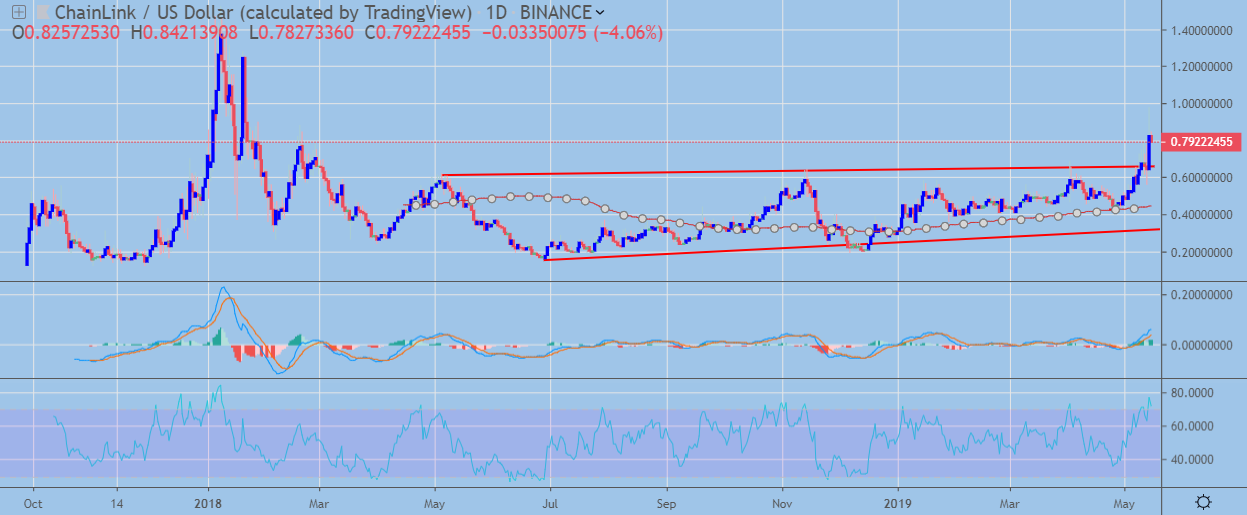 LINK / USD Daily Chart by TradingView
Pattern Watch
Traders should note that a major technical breakout has occurred on the daily time frame now that trendline resistance has been broken.
Relative Strength Index
The RSI indicator on the daily time frame is bullish, although it has now moved into overbought territory.
MACD Indicator
The MACD indicator on the daily time frame is bullish, with both the MACD signal line and MACD histogram issuing buy signals.
Fundamental Analysis
In the medium term the project looks promising. Its decentralized Oracles platform faces little competition, and if successfully deployed on several large networks, can generate a lot of interest from the users and overall crypto community.
Conclusion
Chainlink has performed a major technical breakout on both time horizons, with the LINK / USD soaring to a new 2019 trading high.
If buyers maintain price above major trendline support on the daily time frame the cryptocurrency pair could eventually test towards its all-time trading high.
Check out our coin guide for Chainlink to understand more about oracles.