
Shutterstock photo by Romolo Tavani
Chainlink’s Movement Will Be Defined by Narrow Pocket
LINK prices might be heading to higher levels if a crucial support level holds.
Chainlink is primed for a significant price movement after enduring an 11% correction in the last three days.
Chainlink Primed for Volatility
4-hour charts suggest that LINK’s price action has been contained within an ascending parallel channel over the past two weeks.
Each time the price of LINK has risen towards this technical formation’s upper boundary since February 25, it has been rejected and retraces to the lower edge. From this point, it tends to rebound, consistent with a channel’s characteristics.
Chainlink now sits at a pivotal point following the recent pullback towards the channel’s support trendline. While the 50 and 200 four-hour moving averages at $29 seem to be preventing this cryptocurrency from a steep correction, the 61.8% Fibonacci retracement at $29.70 is acting a strong resistance.
Price Action Could Repeat
It is reasonable to assume that the price action seen over the last two weeks will repeat. Under such circumstances, buying orders might increase, pushing Chainlink to the channel’s upper boundary at $37.
Only a 4-hour candlestick close above or below the $29.00-$29.70 range will serve as confirmation of LINK’s next action.
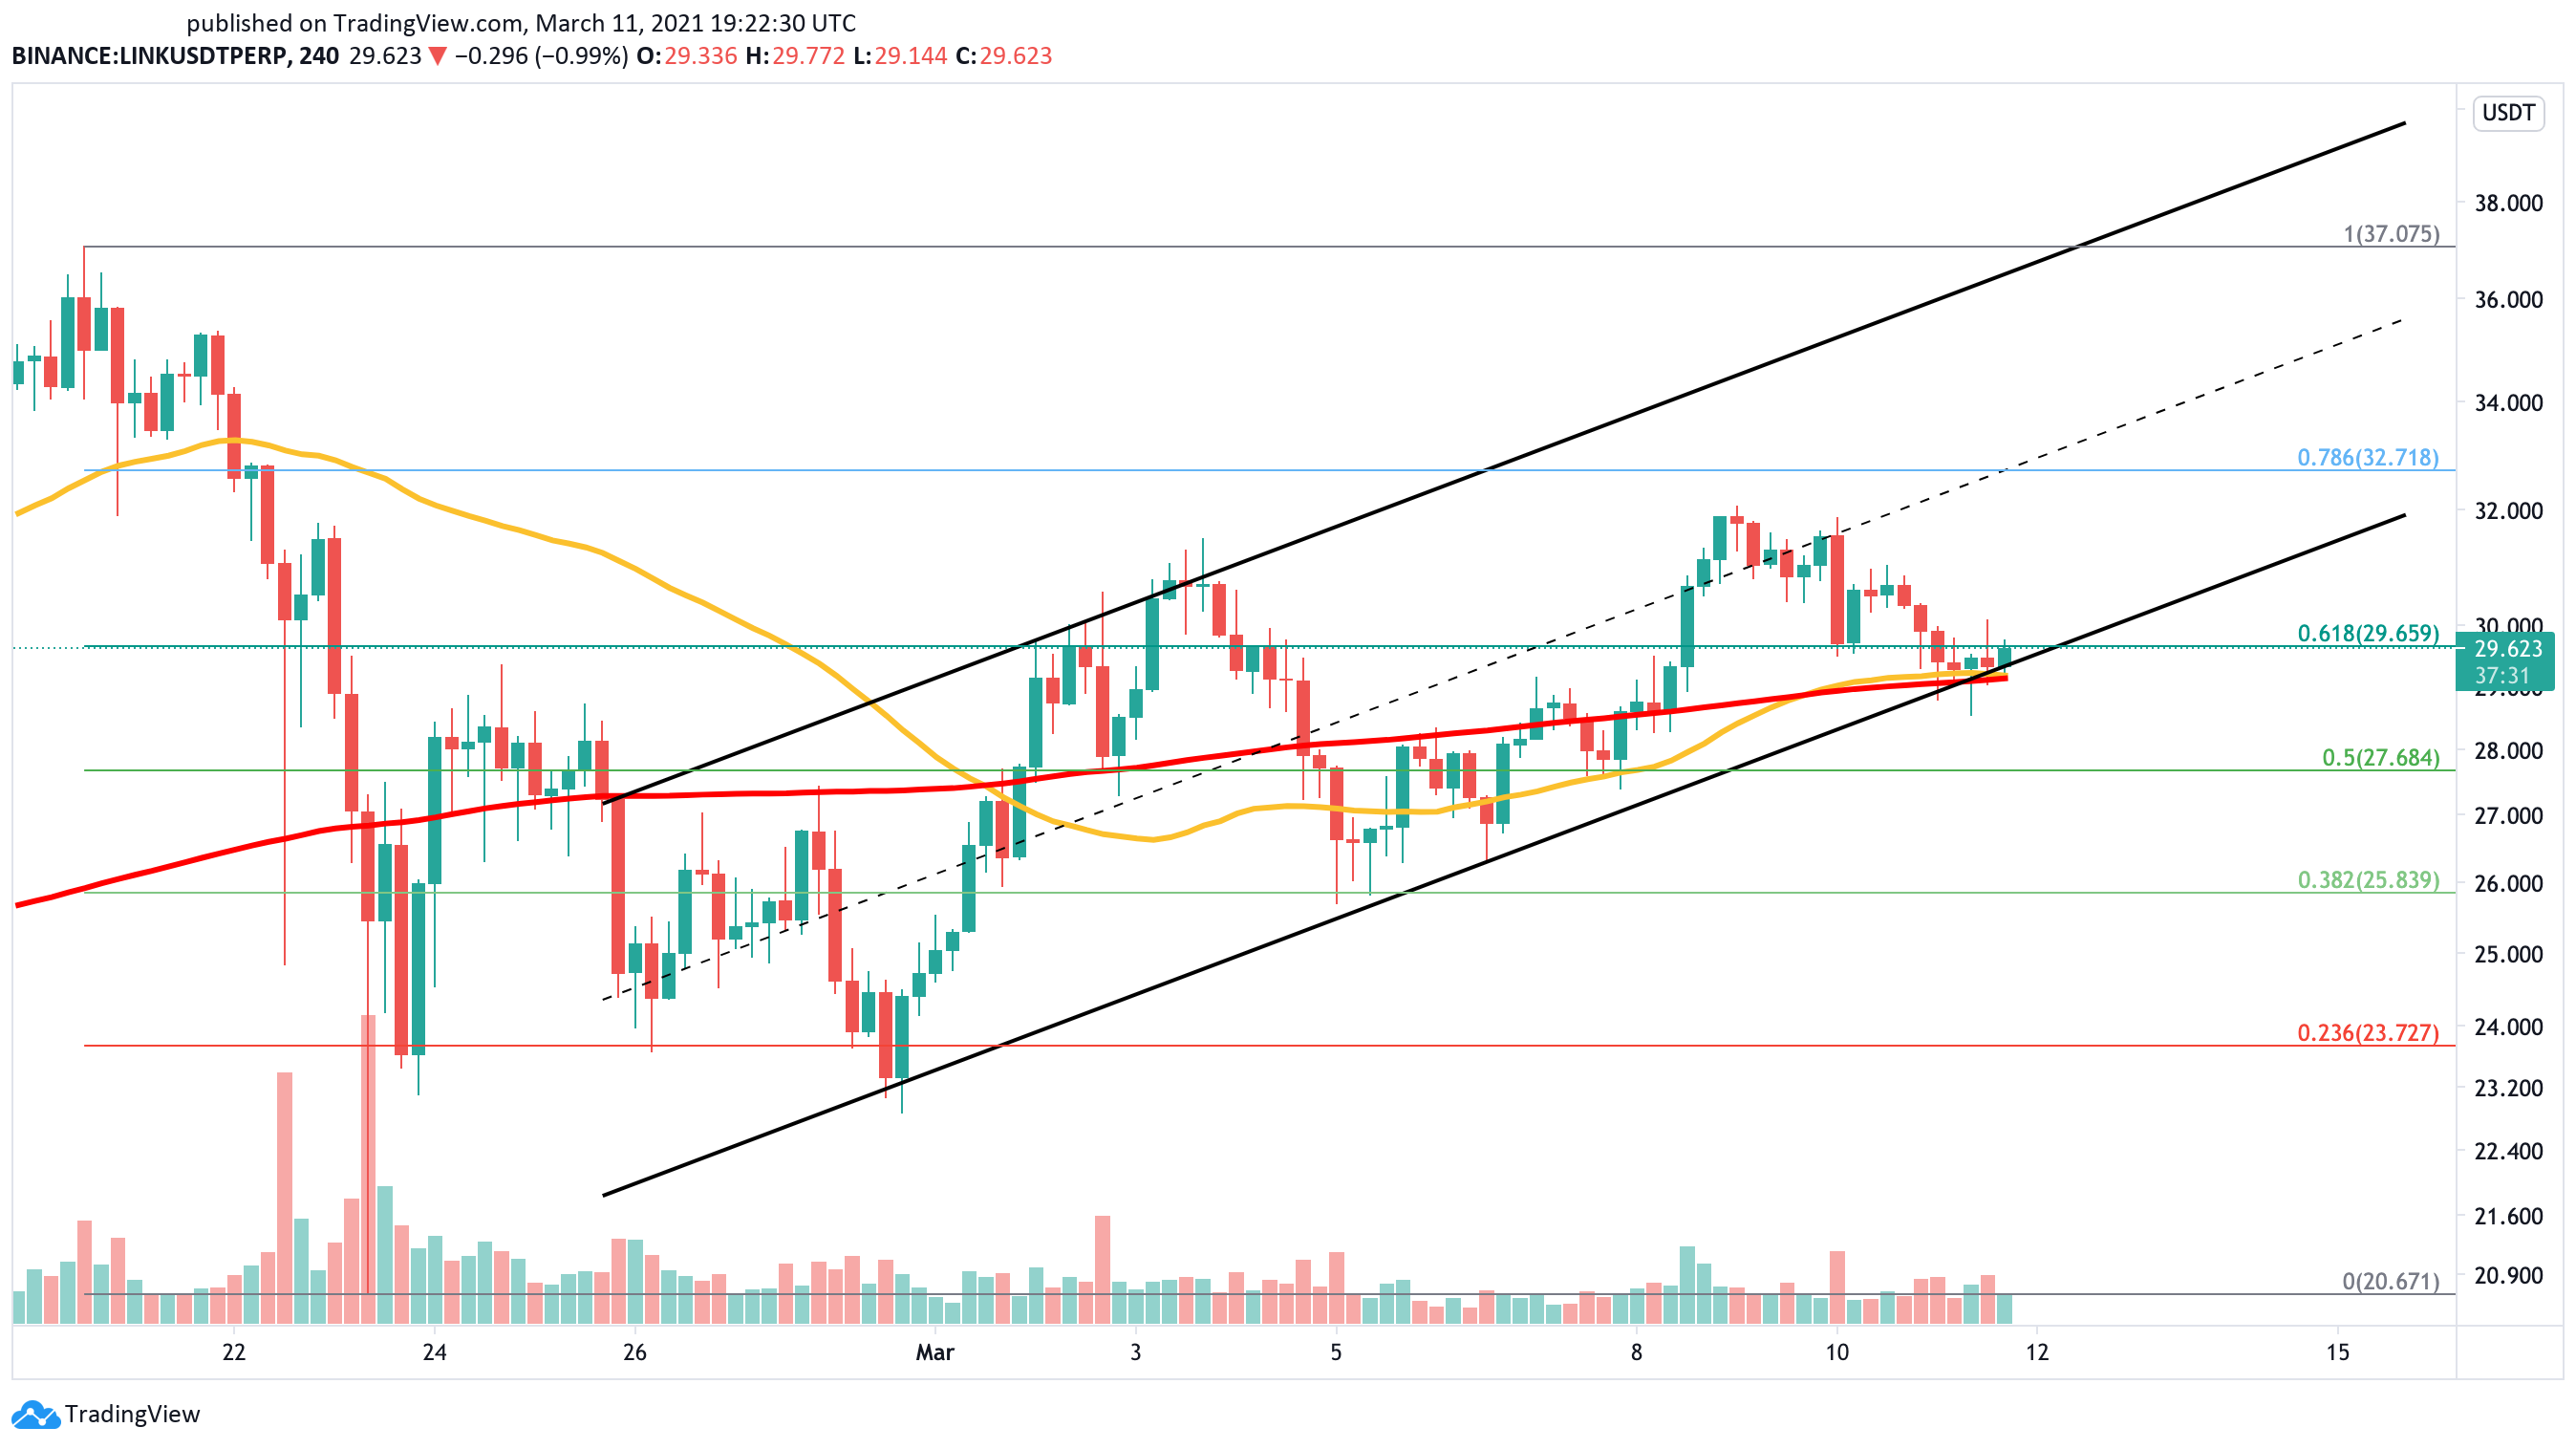
A failure to overcome the $29.70 resistance could spell trouble for Chainlink. Indeed, it could lead to an increase in selling pressure that sends it below the $29 support level.
Such a downswing could provoke panic selling, causing prices to retrace towards the 50% or 23.6% Fibonacci retracement level. These interest areas sit at $25.80 and $23.70, respectively.
Disclosure: At the time of writing, this author owned Bitcoin and Ethereum.