
Shutterstock image by Venus78
Chainlink Must Slice Through Resistance Barrier
LINK token faces an uphill battle despite the massive gains it has posted overnight.
While Bitcoin and Ethereum seem at risk of a painful correction, Chainlink (LINK) has been able to rebound over the past 24 hours. It now faces stiff resistance that will determine where prices go next.
Chainlink’s Uptrend Depends on Resistance
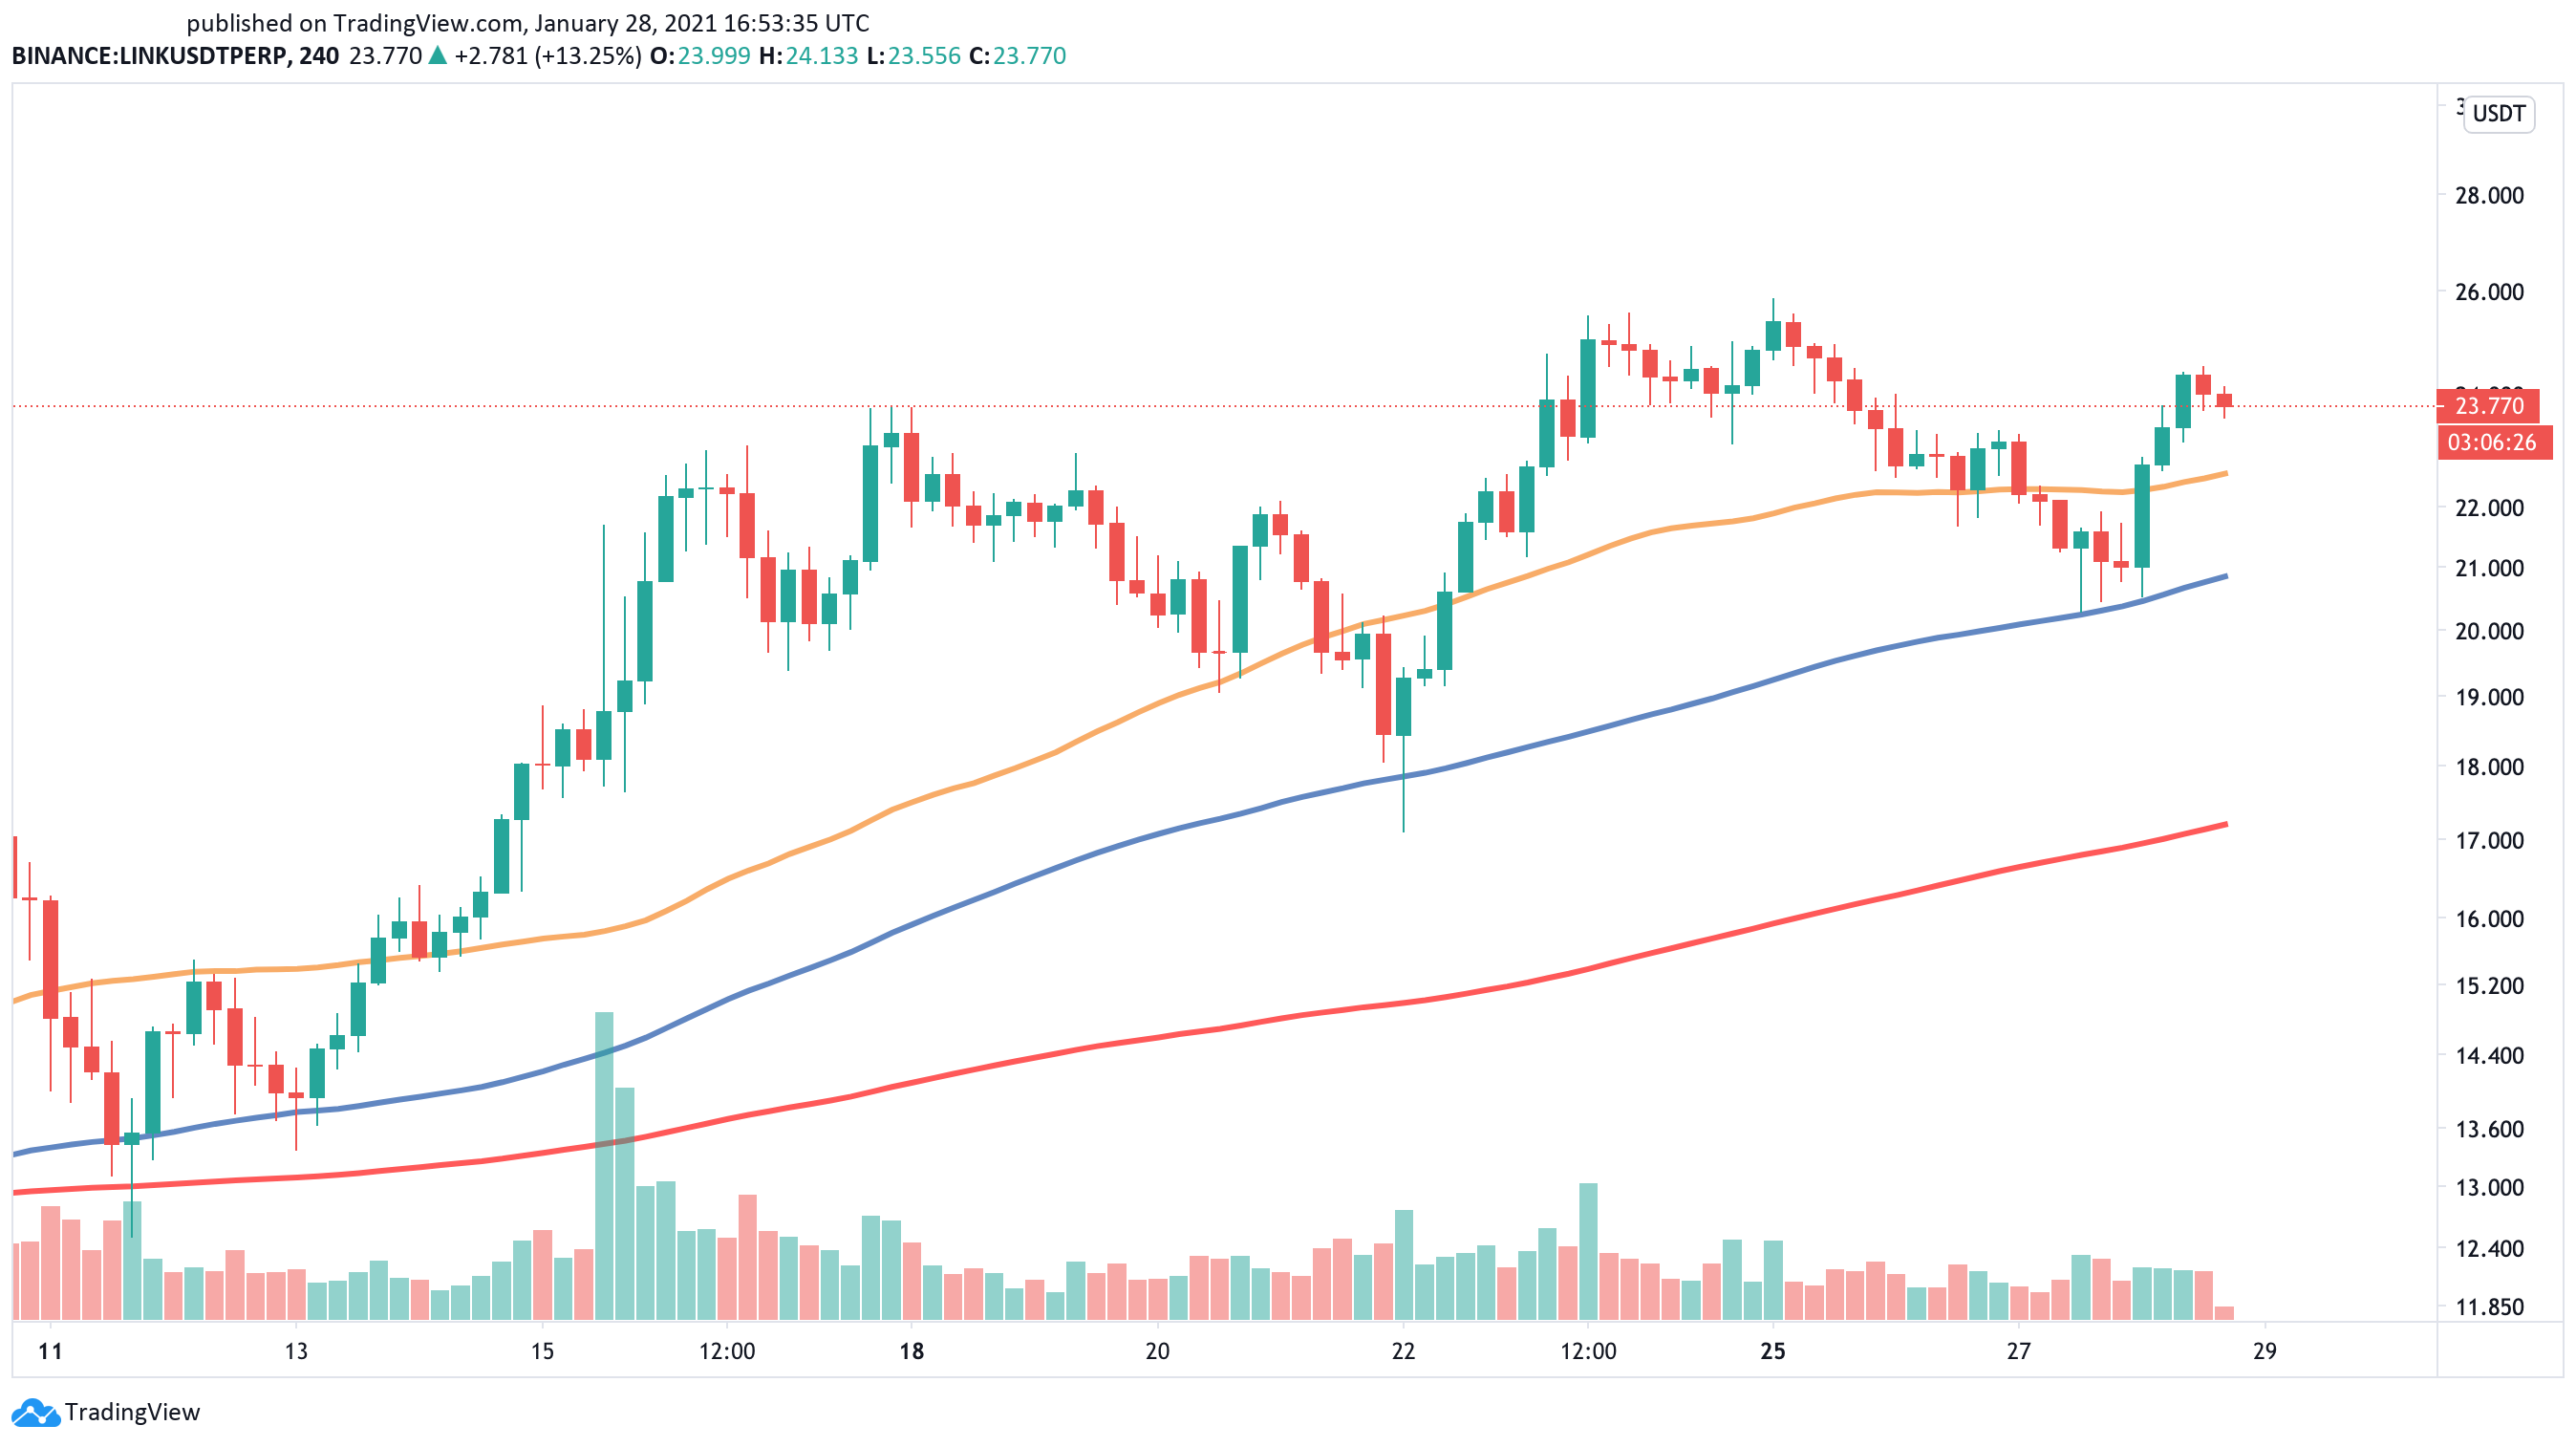
Chainlink’s 100 four-hour moving average kept the coin’s uptrend intact over the past two weeks. Every time that LINK has retraced towards this indicator since Jan. 11, a significant rejection occurs, pushing prices towards higher highs.
More recently, the cryptocurrency fell by 21.50% after reaching a new all-time high of nearly $26. As prices sliced through the 50 four-hour moving average, the 100 four-hour moving average acted as stiff support, allowing Chainlink to rebound.
By bouncing off this crucial hurdle, LINK regained lost ground and rose towards the $24 resistance barrier.
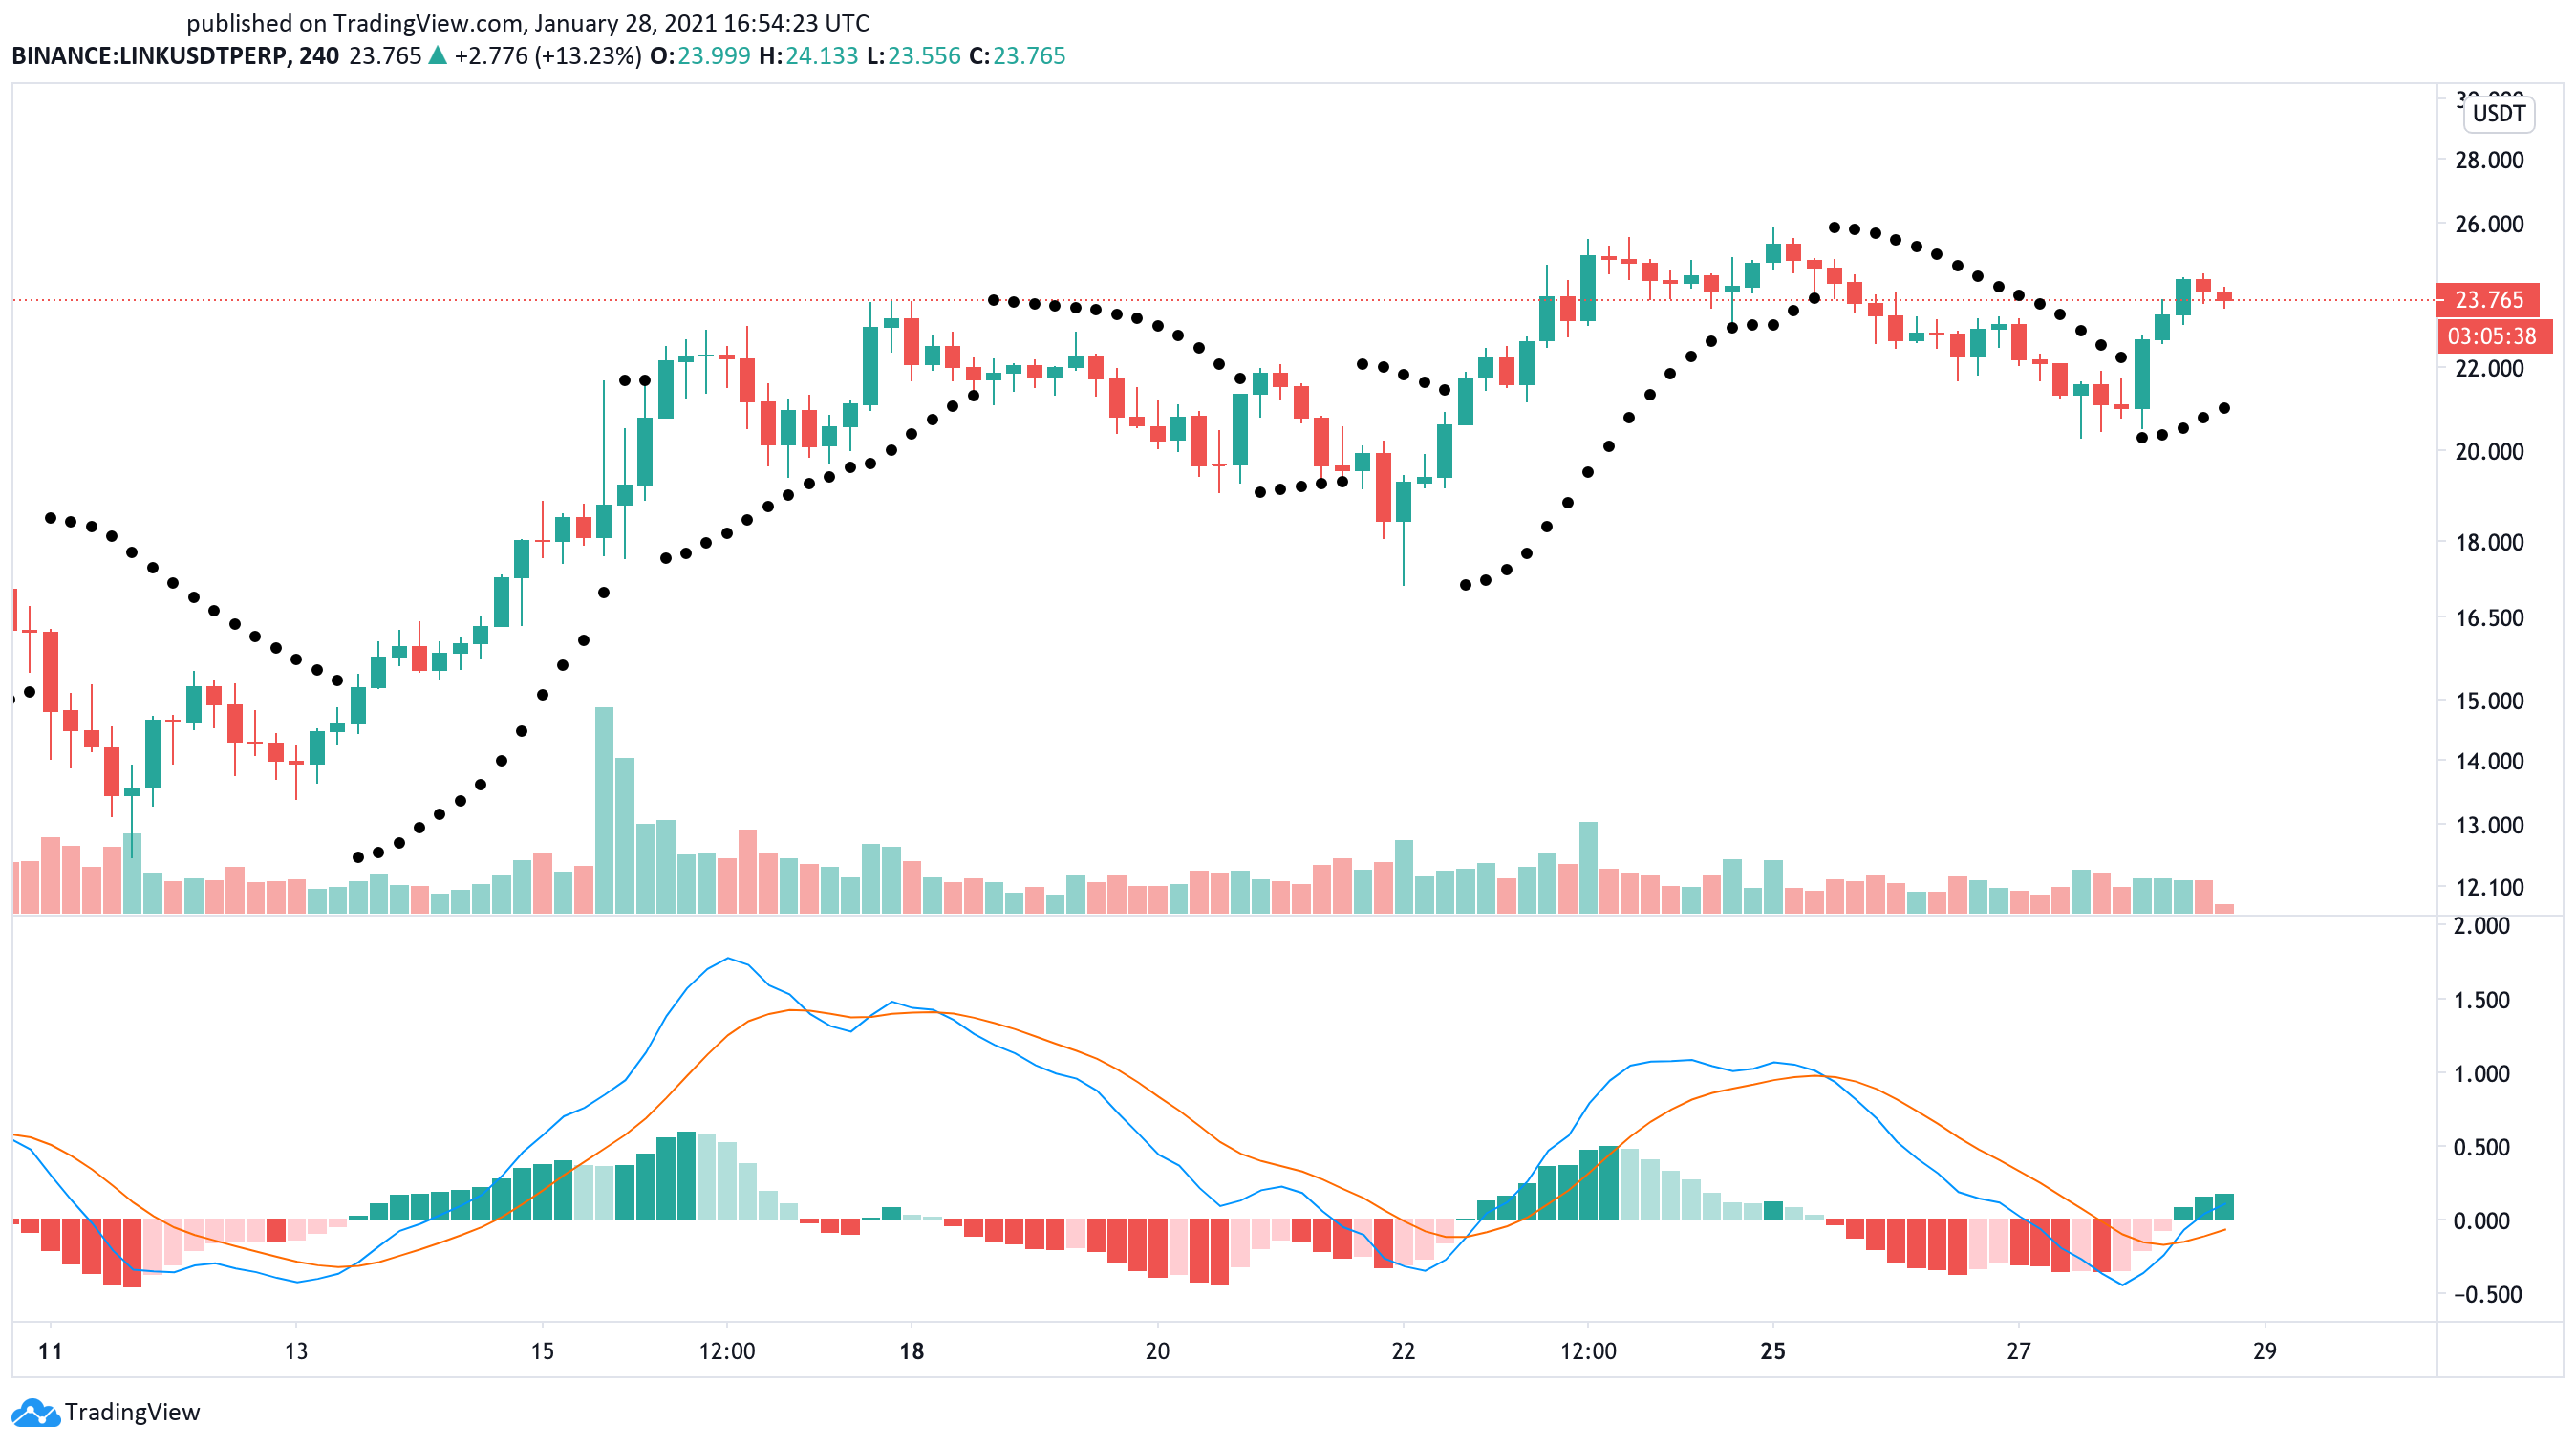
On the way up, the parabolic stop and reverse (“SAR”) moved below Chainlink’s price, indicating that the trend’s direction had changed from bearish to bullish once again.
Historically, the stop and reverse system has been highly effective in determining the course of LINK. The last two times that the parabolic SAR flipped within the 4-hour chart, LINK’s price surged by 25.50% and 25.70%, respectively. Therefore, the recent flip over suggests that Chainlink is primed for further gains.
The moving average convergence divergence, or MACD, adds merit to the optimistic outlook. MACD, which follows the path of a trend and calculates its momentum, also turned bullish within the same time frame. As the 12 four-hour exponential moving average crossed above the 26 four-hour exponential moving average, the odds for higher highs increased significantly.
Still, Chainlink faces a significant resistance barrier ahead that it must overcome before it can advance further.
Based on IntoTheBlock’s In/Out of the Money Around Price (IOMAP) model, nearly 3,400 addresses had previously purchased roughly 1.6 million LINK at an average price of $24.
This supply barrier may have the ability to absorb some of the buying pressure seen recently. Holders with investments that are underwater might try to break even on their positions, slowing down the uptrend. But if Chainlink can slice through this level, it would likely climb toward a new all-time high of $28.
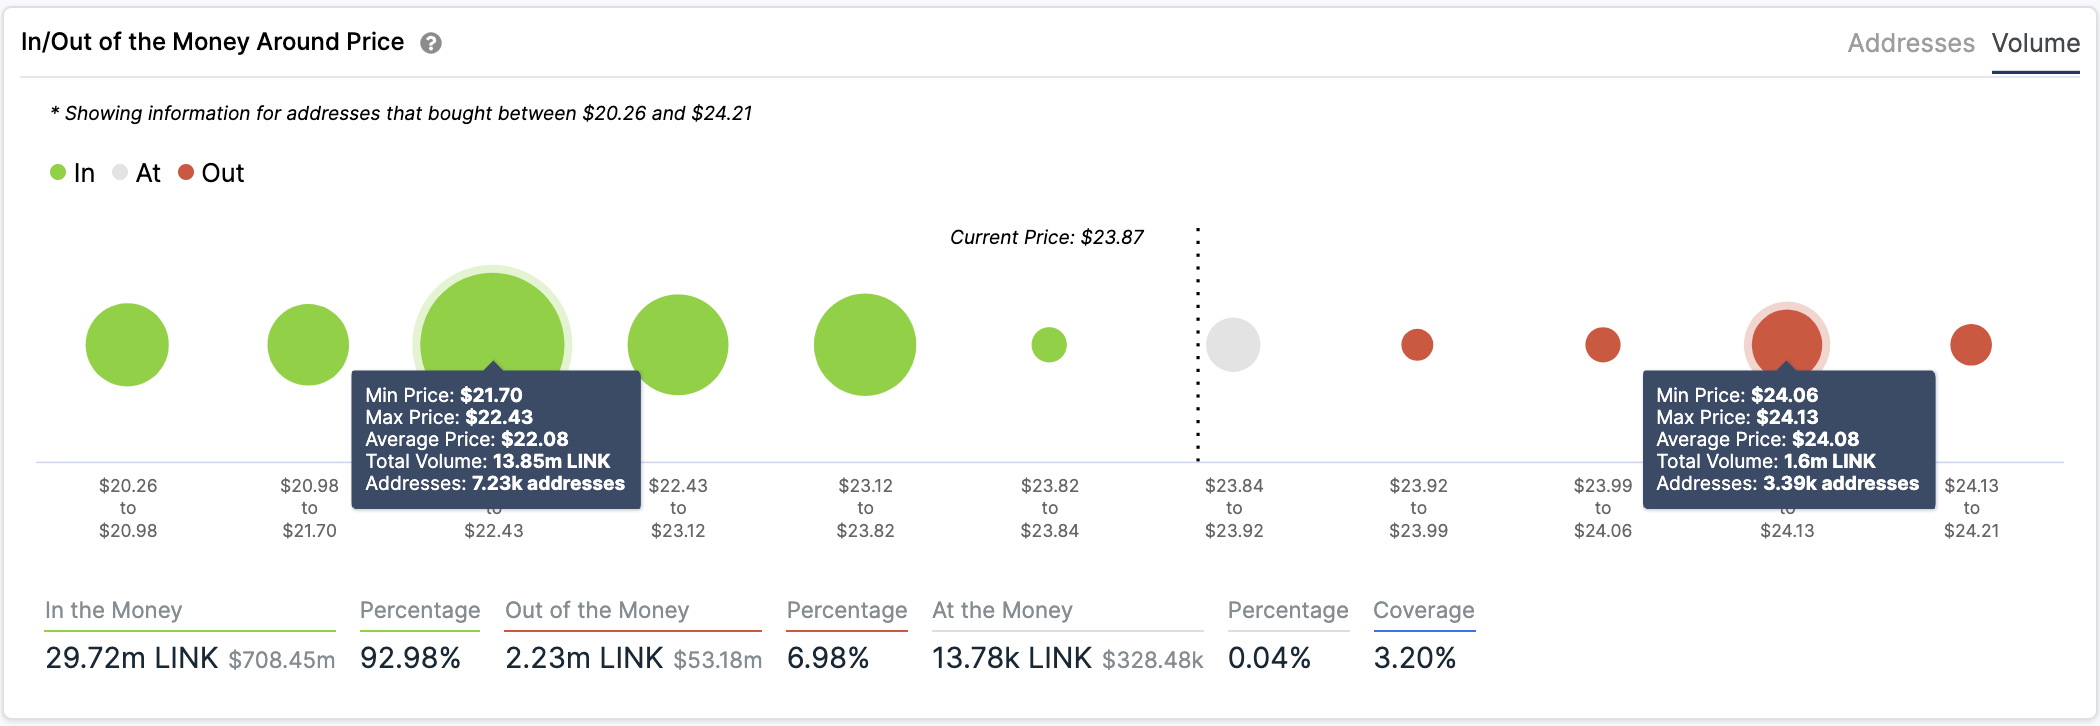
IOMAP cohorts reveal that the 100 four-hour moving average remains a critical area of support. Approximately 7,200 addresses are holding nearly 14 million LINK between $21.70 and $22.40.
Only a 4-hour candlestick close below this demand zone can jeopardize the bullish outlook. Under such circumstances, Chainlink will drop towards the 200-four-hour moving average at $16.50.
Disclosure: At the time of writing, this author held Bitcoin and Ethereum.