
Decred Price Analysis DCR / USD: Bright Future
DCR could reach the best price level of the year.
- Decred has a bullish short-term outlook, with price breaking above key resistance on the four-hour time frame
- The four-hour time frame shows that DCR / USD bulls are attempting to invalidate a bearish head and shoulder pattern
- The daily time frame highlights that a huge inverted head and shoulders pattern could start to take shape
Fundamental Analysis
Decred has gained bullish momentum after Coinbase announced that it is considering to add Decred and other 7 tokens to its platform. If listed on Coinbase, the project can get additional liquidity which will attract more investors and users to its network.
Decred / USD Short-term price analysis
Decred has a bearish short-term outlook, with the cryptocurrency advancing above key technical resistance on the four-hour time frame.
The four-hour time frame shows that DCR / USD bulls are working hard to invalidate a large head and shoulders pattern that has been in play since May this year.
Technical indicators are bullish across the four-hour time frame and continue to issue a buy signal.
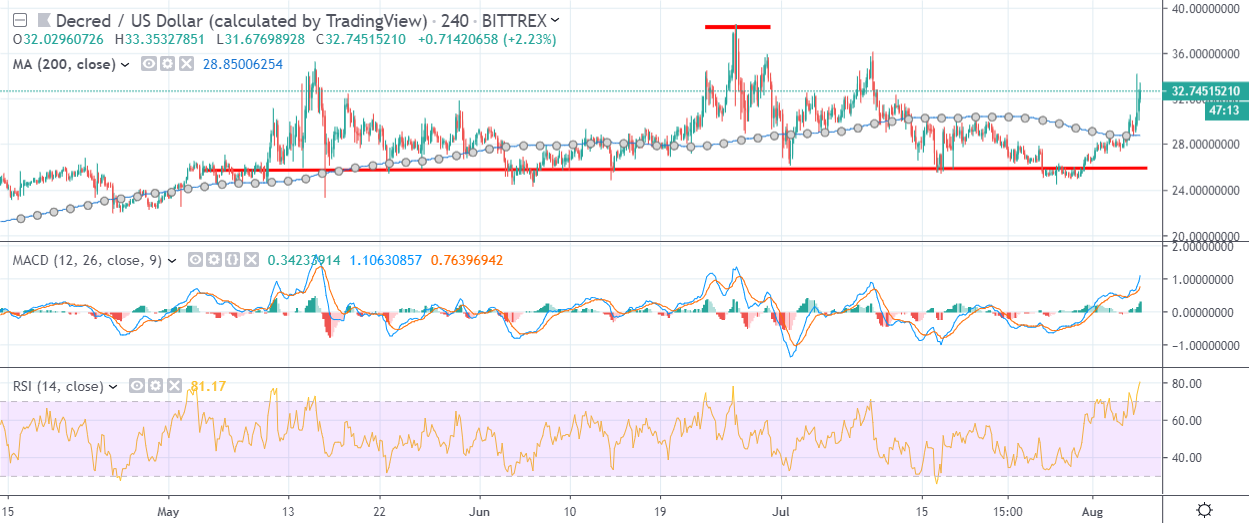
Pattern Watch
Traders should note that a complex head and shoulders pattern will start to form on the four-hour time frame if DCR / USD bulls fail to invalidate the bearish pattern.
Relative Strength Index
The Relative Strength Index is bullish on the four-hour time frame, although it is approaching overbought territory.
MACD Indicator
The MACD indicator has turned bullish on the four-hour time frame and is now issuing a strong buy signal.
Decred / USD Medium-term price analysis
Decred has a bullish medium-term outlook, with the cryptocurrency bouncing sharply from its trend defining 200-period moving average.
The daily time frame shows that an extremely large inverted head and shoulders pattern will start to form if DCR / USD bulls move price above the current 2019 trading high.
Technical indicators are bullish on the four-hour time frame and continue to issue buy signals.
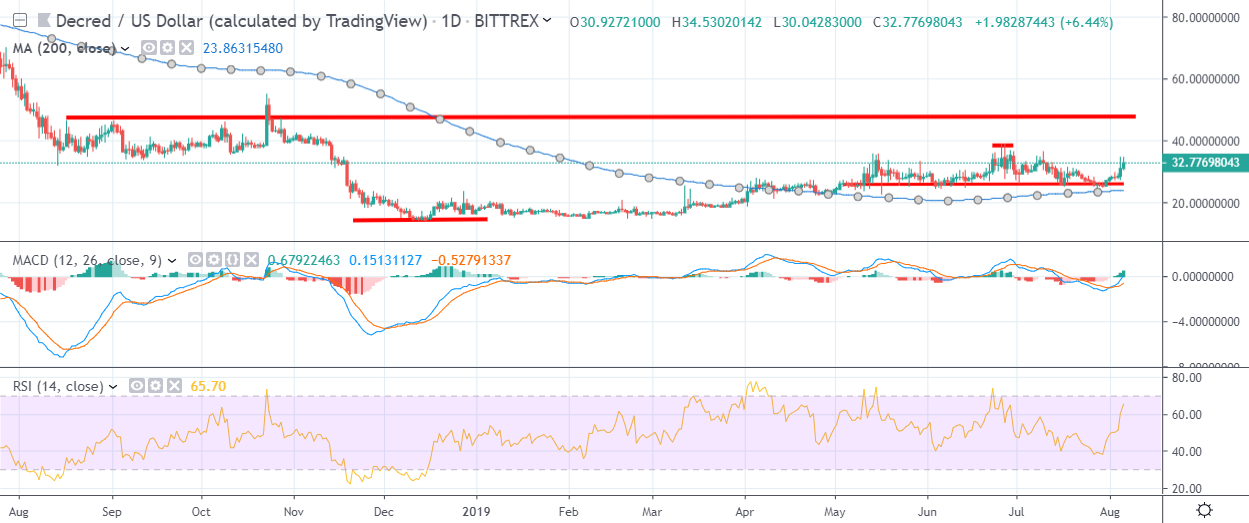
Pattern Watch
It is worth noting that a bearish head and shoulders pattern is also present across the daily time frame.
Relative Strength Index
The RSI indicator has turned bullish on the daily time frame and continues to issue a buy signal.
MACD Indicator
The MACD indicator is bullish on the daily time frame and continues to issue a buy signal.
Conclusion
Decred could post substantial upside gains if bulls can continue to advance the cryptocurrency and invalidate the bearish pattern on the four-hour time frame.
The daily time frame shows that a huge inverted head and shoulders pattern could start to form if the DCR / USD pair lifts above the best levels of the year so far.
What is the Decred project all about? Find out in our coin guide.
The Simetri team has also published a deep overview in the Decred DARE.