
DigiByte Price Analysis DGB / USD: Powering Up
A fresh partnership is causing an uptrend.
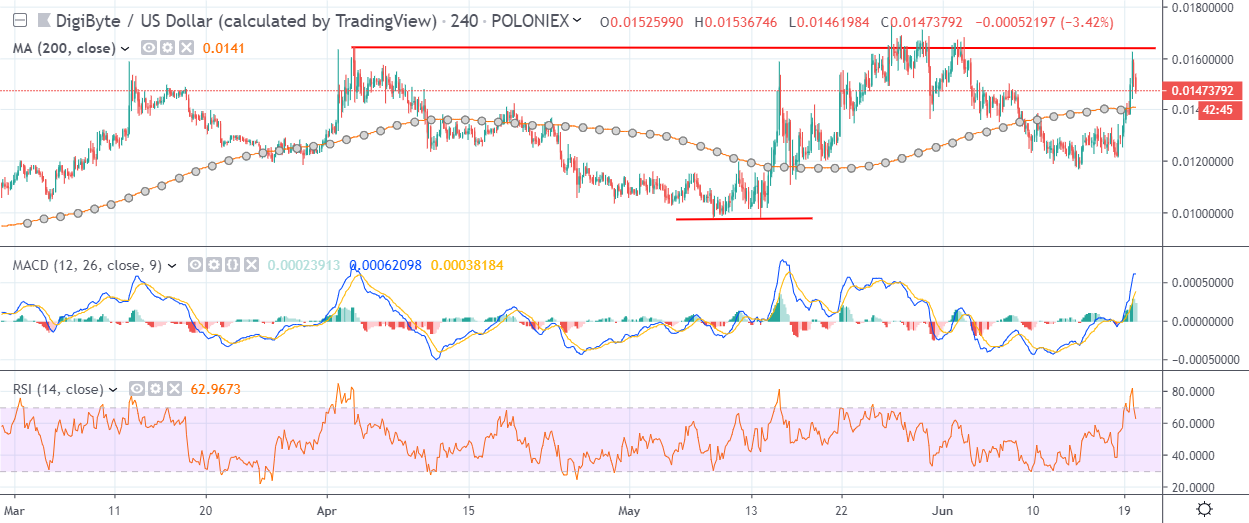
- DigiByte has a bullish short-term outlook, with the cryptocurrency recovering above its 200-period moving average on the four-hour time frame
- A large inverted head and shoulders pattern has formed on the four-hour time frame
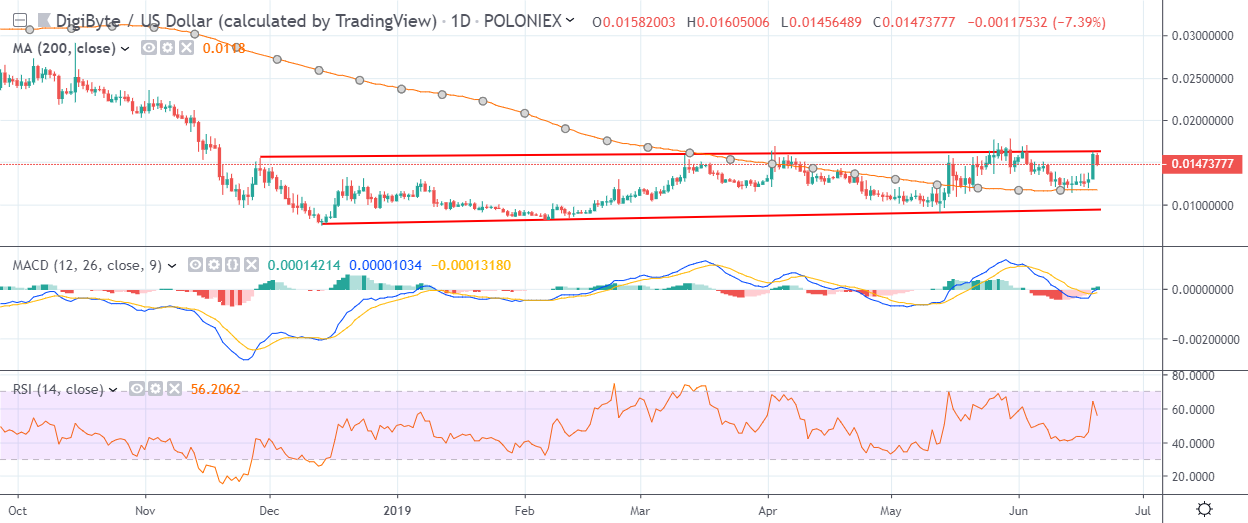
- The daily time frame is showing that the DGB / USD pair is trapped within a rising price channel
Fundamental Analysis
DigiByte price is pumping after the partnership announcement with Netherlands-based company V-ID. In cooperation with V-ID, DigiByte is launching a new ID verification tool that will validate and verify the authenticity of social media profiles. The tool will also help to further increase awareness and adoption of the DigiByte Blockchain.
DigiByte / USD Short-term price analysis
Digitbyte has a bullish short-term trading outlook, with the cryptocurrency rebounding back above its 200-period moving average on the four-hour time frame.
The four-hour time frame is showing that a complex inverted head and shoulders pattern has formed, with the DGB / USD pair testing back towards neckline resistance.
Technical indicators on the four-hour time frame are bullish and continue to issue a strong buy signal.
Pattern Watch
Traders should note that the DGB / USD pair could target the November 2018 swing-high if the bullish pattern is fully ignited on the four-hour time frame.
Relative Strength Index
The RSI indicator is also bullish on the four-hour time frame, although it is starting to correct lower.
MACD Indicator
The MACD indicator is bullish on the four-hour time frame and is continuing to generate a buy signal.
DigiByte / USD Medium-term price analysis
DigitByte has a bullish medium-term outlook, with the cryptocurrency testing towards the upper end of its yearly trading range.
The daily time frame is showing that the DGB / USD pair is trapped within a rising price channel, with buyers attempting to make a much-anticipated bullish range-break.
Technical indicators on the daily time frame are rising and are starting to issue a buy signal.
Pattern Watch
Traders should note that if a bullish range-break occurs the DGB / USD pair could test towards the October 2018 trading high.
Relative Strength Index
The RSI indicator remains bullish on the daily time frame, although it is attempting to correct lower.
MACD Indicator
The MACD indicator on the daily time frame is rising and is starting to issue a buy signal.
Conclusion
The latest move higher has been unable to change the technical dynamics for DGB / USD pair, with the cryptocurrency remaining trapped within its established range.
If bulls can ignite the large bullish pattern on the four-hour time frame, the DGB / USD could finally make a much-needed medium-term range break.
Read our DigiByte coin guide for more information on the project and DGB token.