
EOS Price Analysis EOS / USD: Stable But Critical
EOS continues to struggle below its 200-day moving average.
- EOS has a bearish short-term outlook, with the cryptocurrency trading below its 200-period moving average on the four-hour time frame
- The four-hour time frame is showing that a downside break from a falling wedge pattern is currently underway
- The daily time frame shows that the EOS / USD pair has turned technically bearish
EOS / USD Short-term price analysis
EOS has a bearish short-term trading outlook, with the cryptocurrency once again under heavy technical selling pressure.
The four-hour time frame shows that the EOS / USD pair is trapped within an ascending triangle pattern, with the downside projection close to the 3.000 level.
Technical indicators on the four-hour time frame have turned bearish and are starting to generate sell signals.
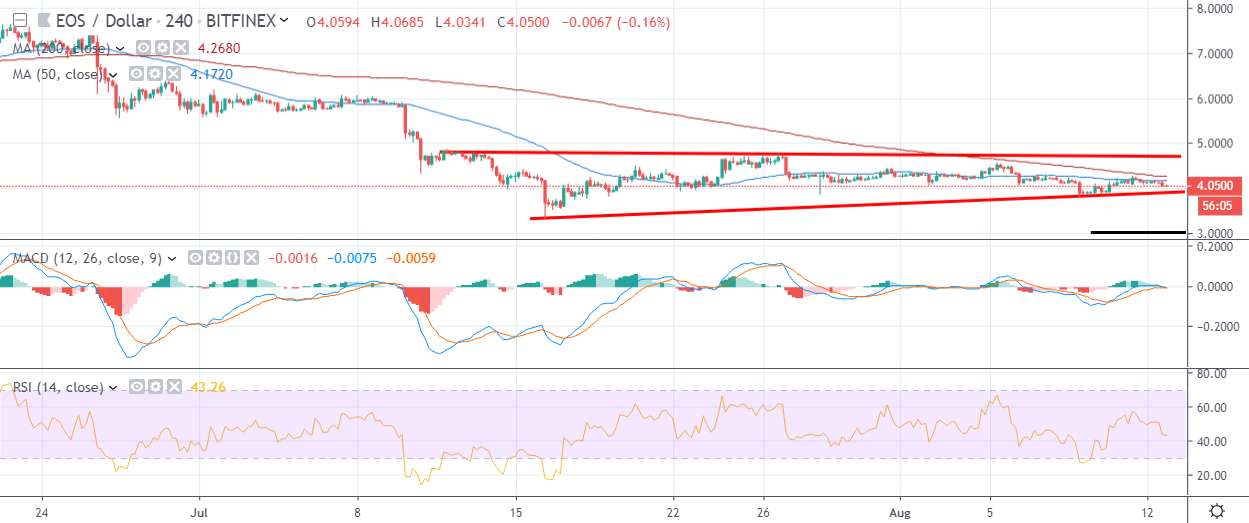
Pattern Watch
Traders should note that a bullish breakout from the ascending wedge pattern will take the EOS / USD pair close to the 5.800 level.
Relative Strength Index
The RSI indicator has turned below neutral on the four-hour time frame and is starting to issue a sell signal.
MACD Indicator
The MACD indicator on the four-hour time frame has turned bearish and is starting to generate a strong sell signal.
EOS / USD Medium-term price analysis
EOS has a bearish medium-term bias, with the cryptocurrency continuing to trade below its trend defining 200-day moving average.
The daily time frame is showing that a bearish correction is still underway, with the EOS / USD pair unable to rally. The daily time frame also highlights the 3.000 support level as a possible bearish target and turning point for the cryptocurrency.
Technical indicators remain bearish across the daily time frame, highlighting the medium-term weakness in the EOS / USD pair.
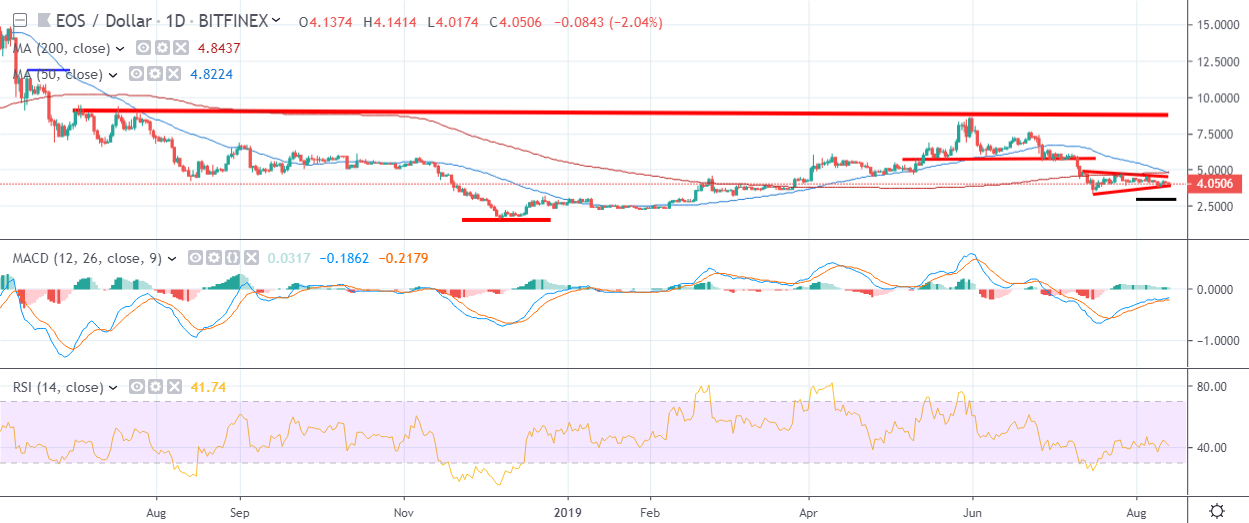
Pattern Watch
Traders should note that the EOS / USD pair remains technically bearish while trading below the 5.000 level.
Relative Strength Index
The Relative Strength Index remains bearish on the daily time and continues to issue a sell signal.
MACD Indicator
The MACD indicator on the daily time frame is conflicted, with the MACD histogram flatlined while the signal line is rising.
Conclusion
EOS has remained consistently weak across both time horizons and continues to struggle below its 200-day moving average.
The patterns on the daily and four-hour time frames suggest that the 3.000 level remains the overall bearish target and possible turning point for the cryptocurrency.
For a quick check up of the basics of EOS, we published a coin guide.