
GXChain Price Analysis GXC / USD: Yet Another Buy-Back
GXChain is surging once again after a buyback announcement.
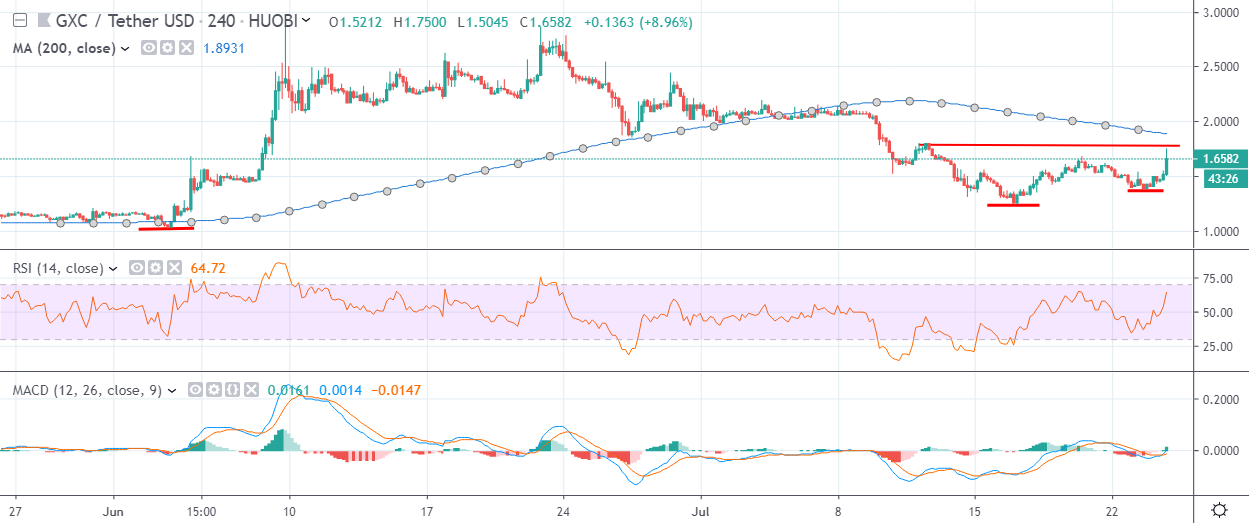
- GXChain has a bearish short-term bias with the cryptocurrency trading below its 200-period moving average on the four-hour time frame
- The four-hour time frame is showing that a bullish inverted head and shoulders pattern is forming
- A bearish double-top pattern continues to weigh on medium-term sentiment
Fundamental Analysis
GXC spiked after the project announced the fourth buy-back round with a $1.5M pool, which would be completed in the following 2 days. The project also promised more rewarding programs in the future, which should increase the interest of speculators in the coin.
GXChain / USD Short-term price analysis
GXChain has a bearish short-term bias, with the cryptocurrency still trading below its 200-period moving average on the four-hour time frame.
The four-hour time frame shows that the GXC / USD buyers have invalidated a bearish head and shoulders pattern. A bullish inverted head and shoulders pattern has now formed across the mentioned time frame.
Technical indicators on the four-hour have turned bullish and continue to issue strong buy signals.
Pattern Watch
Traders should note that the GXC / USD pair is now creating bullish higher lows on the four-hour time frame.
Relative Strength Index
The RSI indicator is bullish on the four-hour time frame and is issuing a strong buy signal.
MACD Indicator
The MACD indicator is bullish on the four-hour time frame and continues to generate a buy signal.
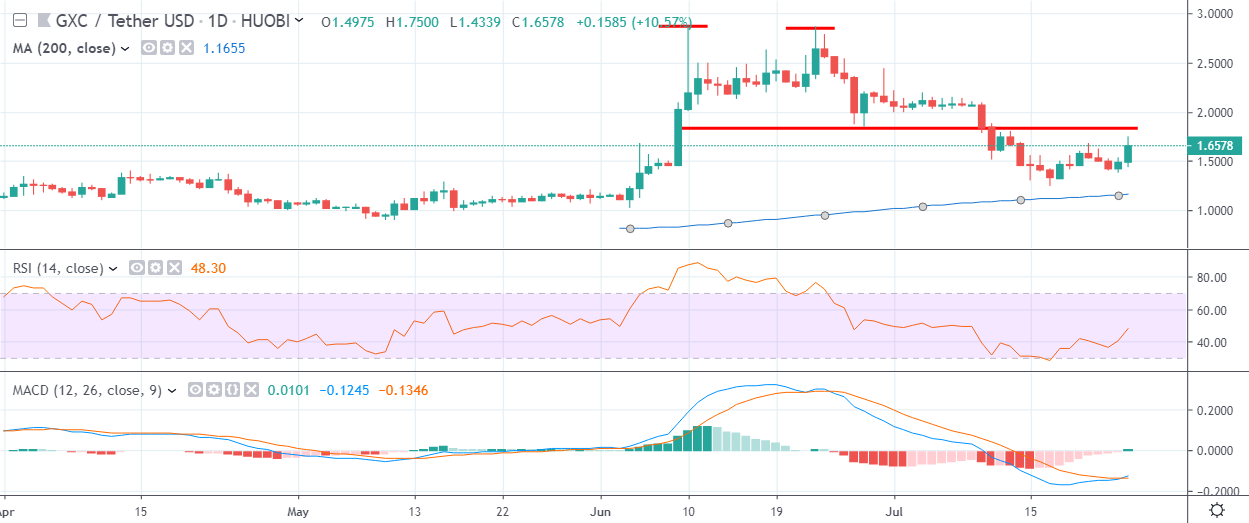
GXChain / USD Medium-term price analysis
GXChain has a bullish medium-term outlook, with the GXC / USD pair still holding price above key support on the daily time frame.
The daily time frame is showing that the GXC / USD pair is now testing back towards key trendline resistance, although a bearish double-top pattern is still weighing on the technical outlook on the mentioned time frame.
Technical indicators on the daily frame are attempting to correct from extremely oversold conditions.
Pattern Watch
Traders should note that a bullish reversal pattern will form if GXC / USD bulls can invalidate the bearish double-top pattern.
Relative Strength Index
The RSI indicator remains technically bearish on the daily time frame, although it is attempting to move higher.
MACD Indicator
The MACD indicator is attempting to turn bullish on the daily time frame and is currently moving away from extreme oversold conditions.
Conclusion
GXChain is attempting to recover its bullish short-term status, with the GXC / USD pair now posting bullish higher lows on the four-hour time frame.
Medium-term bulls now need to launch the cryptocurrency above major trendline resistance in order to encourage the next round of technical buying.
Check out our coin guide for a quick introduction to GXChain.