
Holochain Price Analysis HOT / USD: Tied To Shore
Holochain is relying on its supports right now.
- Holo has a neutral short-term outlook, with the cryptocurrency consolidating around key technical support on the four-hour time frame
- Bearish patterns are starting to build across the four-hour and daily time frames
- The HOT / USD pair continues to trade above its key 200-day moving average on the daily time frame
Holochain / USD Short-term price analysis
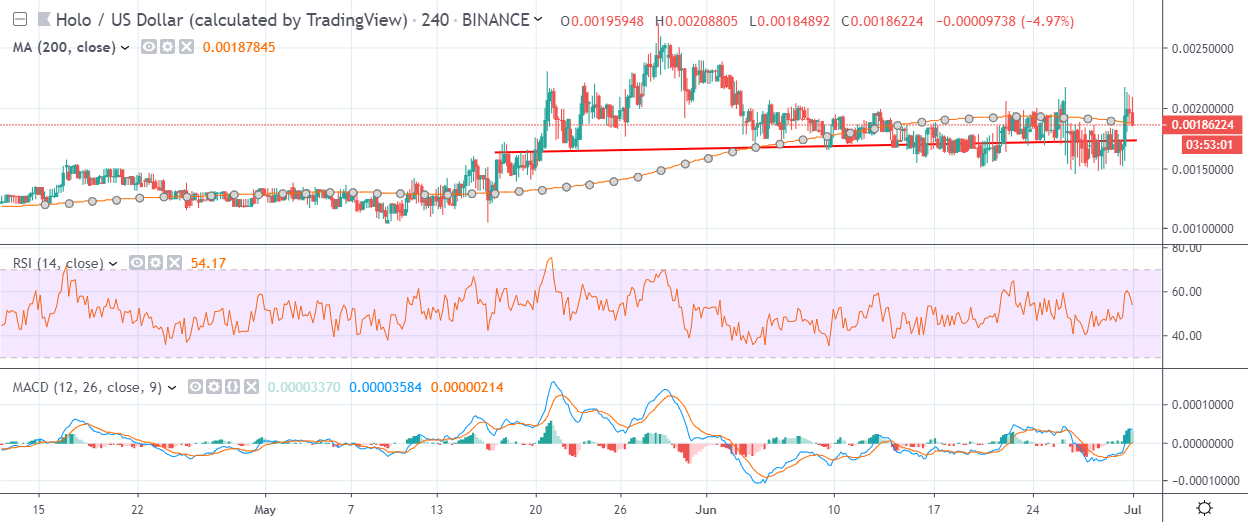
Holo has a neutral short-term trading bias, with the HOT / USD pair consolidating around its 200-period moving average on the four-hour time frame.
The four-hour time frame is showing that a head and shoulders pattern has formed, with sellers repeatedly failing to ignite the large bearish pattern.
Technical indicators on the four-hour time frame are bullish and continue to generate buy signals.
Pattern Watch
Traders should note that the HOT / USD pair’s recent strong gains will be fully eradicated if the head and shoulders pattern on the four-hour time frame time frame is triggered into action.
Relative Strength Index
The RSI indicator is bullish on the four-hour time frame and still shows scope for further upside.
MACD Indicator
The MACD indicator is bullish on the four-hour time frame and is currently generating a strong bullish signal.
Holochain / USD Medium-term price analysis
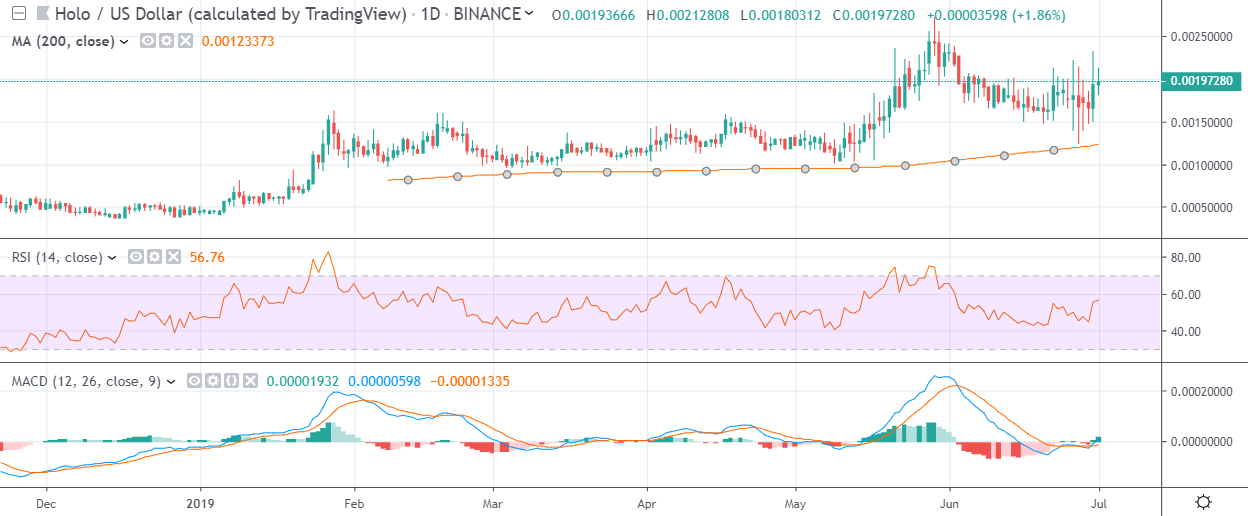
Holo has a bullish medium-term trading bias, with the HOT / USD pair bouncing from its key 200-day moving average.
The daily time frame is showing that a bearish head and shoulders pattern will form if bulls fail to rally the cryptocurrency to a new 2019 trading high.
Technical indicators on the daily time frame are bullish and continue to issue buy signals.
Pattern Watch
Traders should note that it is critical for HOT / USD bulls to eradicate the presence of any potential bearish patterns on the daily time frame.
Relative Strength Index
The RSI indicator is bullish on the daily time frame and still shows scope for further gains.
MACD Indicator
The MACD indicator on the daily time frame is bullish and is still generating a buy signal.
Conclusion
Holo has staged an impressive rally on the daily time frame, underscoring that medium-term bulls are still in control of the cryptocurrency.
With the absence of any clear bullish pattern on both time frames, it is vital that buyers rally the HOT / USD pair back towards its current 2019 trading high.
For a quick overview of Holo and the HOT token, check out our coin guide.
A detailed analysis of the project is available in our DARE.