
IOTA Price Analysis IOTA / USD: Pulling The Trigger
The Coordicide triggered a sizeable bullish run.
- IOTA has a bullish short-term trading bias, with the cryptocurrency advancing to a new 2019 trading high
- The medium-term trading outlook for the IOTA / USD pair has now turned bullish
- The daily time frame is showing that a major technical breakout has occurred
IOTA / USD Short-term price analysis
IOTA has a bullish short-term trading bias, with the cryptocurrency advancing to a fresh 2019 trading high.
The four-hour time frame is showing an inverted head and shoulders pattern has now been triggered, with the IOTA / USD pair continuing its bullish move after testing neckline support.
Technical indicators are rising on the four-hour time frame and continuing to issue a strong bullish signal.
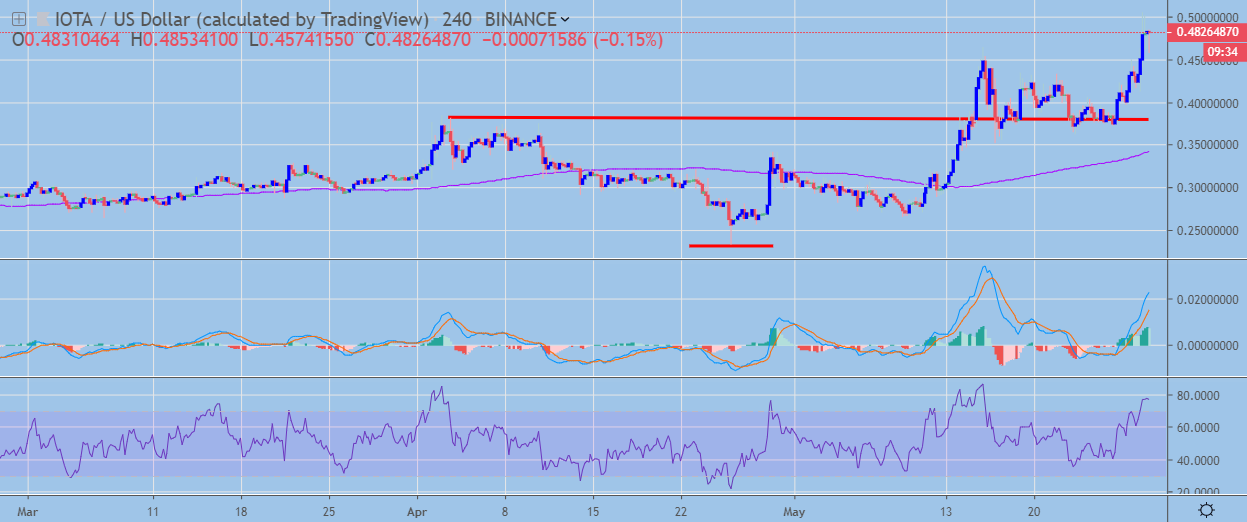 IOTA / USD H4 Chart by TradingView
Pattern Watch
Traders should note that the inverted head and shoulders pattern on the four-hour time frame has yet to reach its full upside target.
Relative Strength Index
The RSI indicator on the four-hour time frame is bullish, although it is now trading in overbought conditions.
MACD Indicator
The MACD indicator on the four-hour time frame has turned bullish and continues to issue a strong buy signal.
Fundamental Analysis
IOTA has gained bullish momentum after the announcement of the Coordicide. The solution will remove the network’s centralized coordinator, and help achieve a greater level of decentralization.
IOTA / USD Medium-term price analysis
IOTA has a bullish medium-term trading outlook, with the cryptocurrency continuing to make strong gains since moving above its 200-day moving average.
The daily time frame is showing that a major bullish breakout has occurred from a sideways price channel that has been in place since the start of 2019.
Technical indicators on the daily time frame are bullish, although they are starting to appear overstretched.
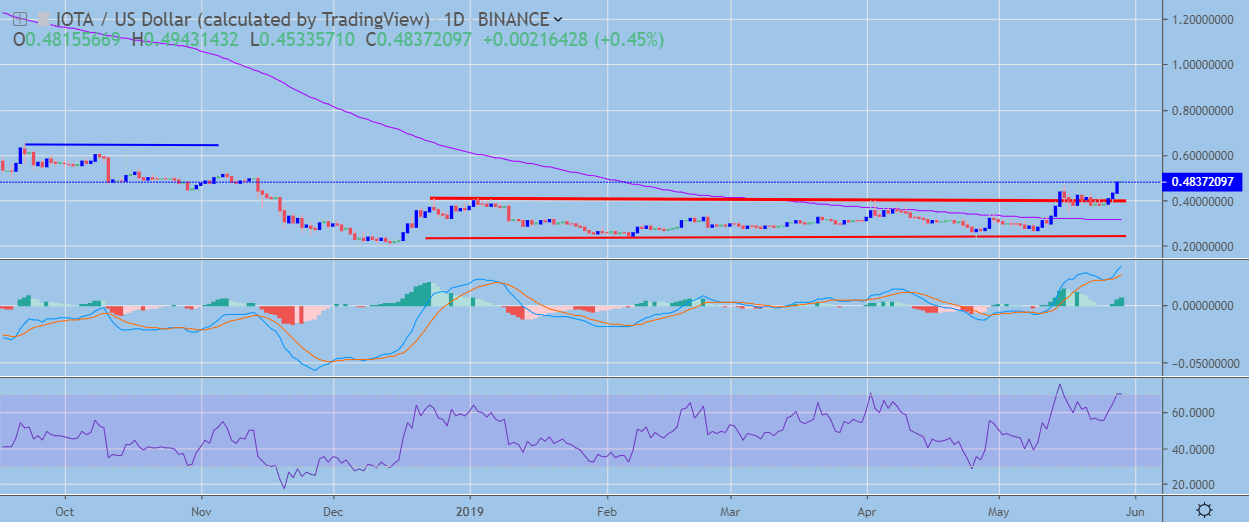 IOTA / USD Daily Chart by TradingView
Pattern Watch
Traders should note that the September 22nd, 2018 swing-high is the overall upside target of the recent channel breakout on the daily time frame.
Relative Strength Index
The RSI indicator is bullish on the daily time frame and continues to highlight growing upside momentum over the medium-term.
MACD Indicator
The MACD indicator on the daily time frame is bullish, although it is starting to appear overstretched.
Fundamental Analysis
The announced Coordicide release could generate additional interest in the project. However, despite the project’s developments and partnerships, adoption still remains its main concern. Therefore, IOTA’s medium-term prospects will depend on its ability to find partners that will drive the adoption of its platform.
Conclusion
Further upside in the cryptocurrency is still expected over both time frames, with the bullish pattern on the four-hour time frame yet to reach its upside target.
Overall, the recent bullish channel breakout on the daily time frame has changed the technical picture for the IOTA / USD pair over the medium-term, with the balance of risk now firmly tilted to the upside.
To get a quick refresher course on IOTA, check out our coin guide.
A deep dive analysis of IOTA is available here.